
It is fairly obvious that water power depends on the availability of water. That likely availability is vital for sizing installed turbine capacity. It is equally true to say that the sizing of spillways depends on reliably estimating flood size. Long term yield and likely floods are both determined on the basis of historic records and conventional wisdom analyses these assuming they are stochastic, or random. Yields are assessed on the basis of mean long-term values and, say 95% reliability.
In practice wouldn’t it be good if we could predict not just long-term averages but also when the wet years were going to arrive and also the dry years? Well, perhaps we can.
Some years ago the writer analysed the levels of Lake Victoria in east Africa as part of a major refurbishment project. This revealed a clear cyclic behaviour in lake level and hence in discharges from the lake down the Nile system and up into Egypt. More recently the writer has been working on the potential yield of a proposed major hydropower development in Zambia. Again clear cyclic patterns were evident in the record. In the course of working on both these projects it became clear that others had also identified cyclic patterns elsewhere in Africa and in other parts of the world.
In the short to medium term horizons required for financial planning purposes on hydropower projects, a recent study by Rydgren et Al (2007) for the World Bank concluded that natural variability would dominate over any longer term trends due to man-made climate change. This makes the identification of such natural patterns especially useful and valuable.
A recent paper included in the Proceedings of the Institution of Civil Engineers (Mason, 2010), focused on African correlations. This article is based on the ICE paper but also gives some other examples.
Lake Victoria – East Africa
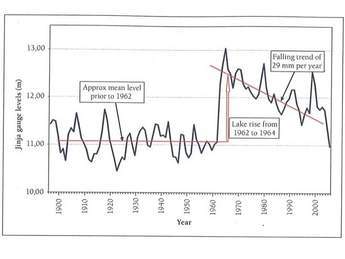
At 67,000km² and bordered by Kenya, Uganda and Tanzania, Lake Victoria is the third largest lake in the world. Its catchment is nearly the size of the UK. From 1900 to around 1960, Lake Victoria levels oscillated fairly constantly about a Jinja gauge level of +11m. But a dramatic rise in lake levels throughout East Africa occurred in the early 1960s, including those of Lake Victoria.
The lake discharges into the Nile system via the Owen Falls hydropower station. The writer was involved in refurbishing the works at Owen Falls in the 1990s and revisited an apparent solar correlation with Lake levels observed back in the early 1900s. The resulting analyses showed not only a falling lake level after 1964 but also an oscillation around that falling trend which, again, appeared to demonstrate a solar correlation, (Mason 1993, 2006a) [see Figures 1 and 2].
The falling trend in Lake level meant that the new Kiira hydropower station commissioned in 2000 did not, in fact, produce any long-term, additional energy for Uganda. The predictable fall in Lake levels coupled with some over-abstraction led to a temporary halt of generation at Kiira in 2007.
If the historic cyclic patterns of Lake behaviour continue, a lake level oscillation around mean annual Jinga gauge levels of approx +10.65m and +11.25m will correspond to 11 year cyclic outflows varying between about 500 and 730m3/sec. For a scheme with an operating head of about 22m it has been demonstrated (Mason 2006b) that these will convert into significant annual revenue differences. Any new hydropower generation coming on stream during an upward trend in lake level will pay back investment costs approximately two years earlier than if generation commenced on a falling trend, (see Figure 3).
Kafue River – Zambia
A recent study by the writer demonstrated that 20-year mean flows in the Kafue River in Zambia corresponded well to reconstructed rainfall records based on regional tree ring records. The tree ring records extended back 200 years and this allowed the identification of clear cyclic behaviour. The work was carried out as part of an IFC funded study (Kafue Gorge Lower Hydroelectric Project, 2009).
The results of the Kafue correlations are shown in Figure 4. They show a dominant period of 70 years accounting for about 50% of the correlation followed by a secondary period at 130 years accounting for about 25%. Tertiary periods at 35 and 44 years account equally for the remainder.
The relationships shown in Figure 4 allow hypothetical mean annual rainfalls to be extended into the future. This suggests that these can be used to estimate future long-term trends in rainfall, river flow and hence hydro generation capability. Indications are for flows to increase over the next few decades, meaning the increasing trends in river flow may occur sooner than implied by Figure 4.
Africa generally
Frossard E. et al (2006) explored the mean annual flows in major rivers throughout Africa between 1945 and 2000. They also explored the wider record for the Zambezi between 1905 and 1995, reflecting the broad underlying trends shown in the preceding section. Frossard demonstrated a generally increasing trend of African river flows between 1950 and 1970 followed by a decreasing trend thereafter (Figure 5).
Frossard highlighted the need for understanding such long-term trends in hydrology by sighting the design of the Kariba dam. The original spillway design capacity for Kariba was shown to be inadequate by the arrival of two massive floods during its construction. These led to a re-evaluation of the hydrology as the dam was being built and the original design outflow capacity of 6000m³/sec using four gated openings being changed to six gated openings giving 9000m³/sec.
Rio Parana – South America
The Rio Parana has a catchment area of 3,100,000km2 and a mean stream flow of 21,300m3/sec. It is the fifth largest river in the world by drainage area and the fourth largest by stream flow. It collects water from Brazil, Paraguay, Bolivia, Uruguay and Argentina. Its eventual outlet into the Atlantic Ocean is via the Rio de la Plata and the Salto Grande hydroelectric scheme.
Studies by Mauna and Flamenco (2005) analysed annual river flows from 1900 to 2000. They subtracted annual flow values from 11 year running mean values and then carried out a similar exercise for solar variation using sunspot numbers. The resulting values for both flow difference and sunspot number difference were then normalised by subtracting the mean values and dividing by their respective standard deviations. The results are shown on Figure 6 and show a clear correlation between river flow and solar variation. They refined the comparison still further by also demonstrating a correlation with shorter term El Nino effects.
In a later paper (Mauna and Flamenco, 2008) they repeated the exercise using not only sunspot numbers but also reconstructed solar irradiance values, with equally convincing results. While the results can be used for assessing likely future generation potential at the Salto Grande station they can also be used to assess years of likely highest future flood risk.
Ireland
A paper by Alexander et Al (2007) records studies by Nico Willemse. Willemse studied the departure of Irish rainfall from the long-term mean precipitation values. He used data from a number of meteorological stations in the Republic of Ireland including Dublin, Malin Head, Valencia and Birr. The selection ensured a complete geographic coverage from north to south and included more than 46,000 data sets, some extending back to 1881.
Willemse compared the cumulative departure of annual rainfall values with an equivalent departure of sunspot numbers from the cumulative mean. The results are shown on Figure 7 for Dublin. They demonstrate a clear correlation between rainfall variation and solar variation in the Republic of Ireland from 1881 to 2005.
England
Some years ago, Brooks and Carruthers (1953) identified an annual rainfall periodicity in England of 51.7 years. They noted that individual wet years were still possible at the dry point in this cycle and individual dry years were still possible at the wet point the cycle. But what they demonstrated was that the probability of a wet year was almost twice that of a dry year near the 51.7 year maximum while near the minimum it was less than half.
Further studies on the variations of extreme hourly rainfalls in the United Kingdom were made much later by May and Hitch (1989). They identified clear base cycles in the rainfall record of 7.2, 10.8, 20 and 50 years. It can be assumed that the 50 year cycle corresponded broadly to the 51.7 year cycle identified earlier by Brooks and Carruthers. However they also noted that the 7.2 and 10.8 year cycles combined to give apparent cycles of nine and 13 years.
Worldwide
The sections above identify periodicities in the rainfall and/or river run-off from Africa, South America and the British Isles. Similar periodicities are indicated in records from many other parts of the world such as China and North America. These have been explored with great detail by Burroughs (2003) and are shown in Table 1 from the paper by Mason (2010).
However, detailed hydrological records are often not available and so in order to identify historic climatic variation we can use proxy data, such as lake sediments and tree rings. The results from such data are shown on the second part of Table 1. This summarises periodicities from examples in the Middle East, China, North America, Africa and northern Europe.
Various groupings of periodicity are evident in Table 1. Those of between 3 and 3.8 years almost certainly correspond to El Nino. Those of 18.6 years could correspond to that of known lunar tidal effects. It has been argued that those close to 11, 22, 90 and 200 years match known periodicities in solar variation.
Lessons for the future
Cyclic variability in weather patterns has been explored and debated in the past but for practical engineering purposes it has generally been ignored. Conventional analyses for hydropower yield and flood assessment generally assume any records to be random. One problem with periodicities is that unless one is actively looking for them one is unlikely to find them. Cyclic trends are often intermittent and discontinuous while their causal mechanisms are also often unclear and without that understanding there is natural caution against relying on them.
However with increased availability of data and the increased ease with which such data can be processed surely it is about time the profession expanded its horizons. As demonstrated in the preceding sections, an understanding of periodicity in the record can improve investment timing. It can also improve an understanding of required flood design capacity. The assessment of design floods based on a hydrological record is meaningless unless one knows whether the basic data set corresponds to a dry, average or wet phase in terms of long term hydrology. This is not only true for final works but also for planning the capacity and timing of river diversion during construction.
In the wider context an improved understanding of apparent periodicities in the natural record would seem to offer at least one planning scenario to be considered in terms of investment and even for the long term planning of aid and famine relief. It can only be hoped that as climatic data sets continue to be expanded, their analyses will include not only statistical probabilities but also cyclic variability as an aid to the long term planning of those aspects and also of major civil infrastructure.
Dr Peter Mason can be contacted at peter.j.mason@mwhglobal.com
TablesTable 1


