

Whether they’re involved in nuclear power generation or some other industry, nearly every owner or manager of heat exchanger assets faces the same set of issues when they evaluate their eddy current inspection campaigns:
– Budget and schedule constraints can restrict testing to a small sample size, perhaps as few as 3 to 5 percent of the available tubes.
– Manual analysis of eddy current inspection data is tedious work and subject to human interpretation. Individual analysts can be inconsistent in their ability to identify indications and historical trends, leading to additional downtime and the use of more complex testing methods, like array coil inspections for greater detection capability.
– Eddy current data analysts are in short supply and need to be as productive as possible. It’s a challenge to maintain a team with the proper training, qualifications and experience to analyze and report all the data while the inspection crew has access to tubes and other components.
Any of these factors can cause asset owners to question the overall effectiveness and value of eddy current inspections of heat exchangers. Testing-service providers are aware of this, too.
“Our job might entail testing literally tens of thousands of tubes in a window of less than two weeks,” said Marc Brown, Principal Level III and a partner at NDE Technology in Jackson, Michigan, USA, which provides eddy current and other nondestructive testing services for the nuclear power industry in the United States. “We have only so much time to complete the work, yet it’s essential that we’re delivering accurate results quickly and on budget.”
Eliminating a bottleneck
Fortunately, Brown said, the latest eddy current probes, handling equipment and instruments can acquire large amounts of inspection data at fast rates. Manually analyzing the results, however, is a bottleneck.
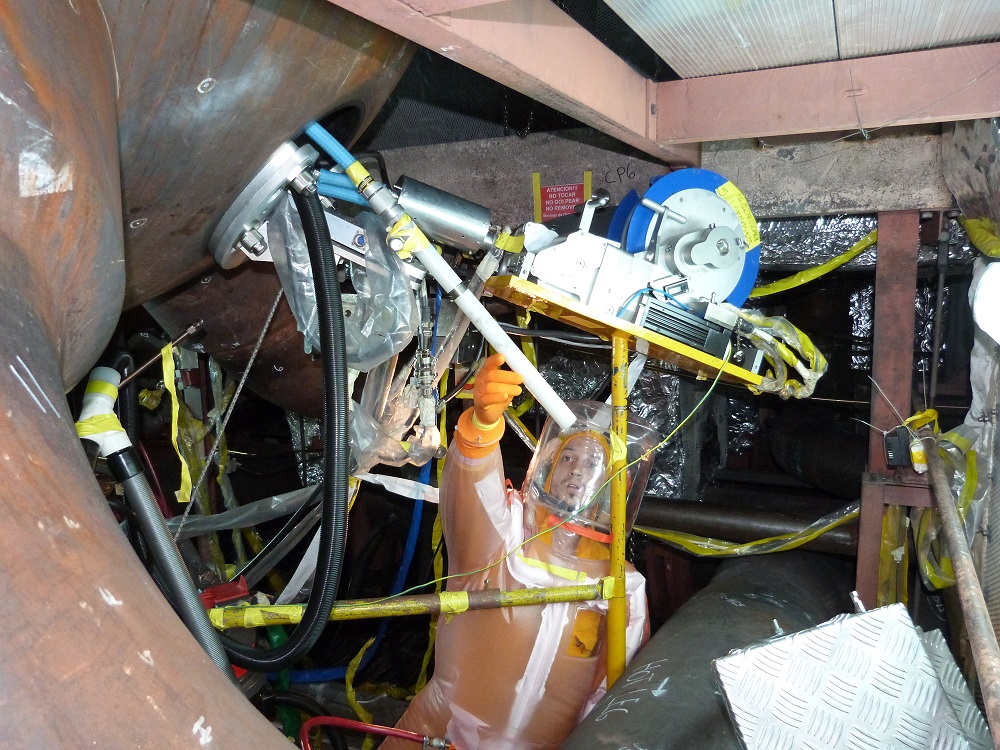
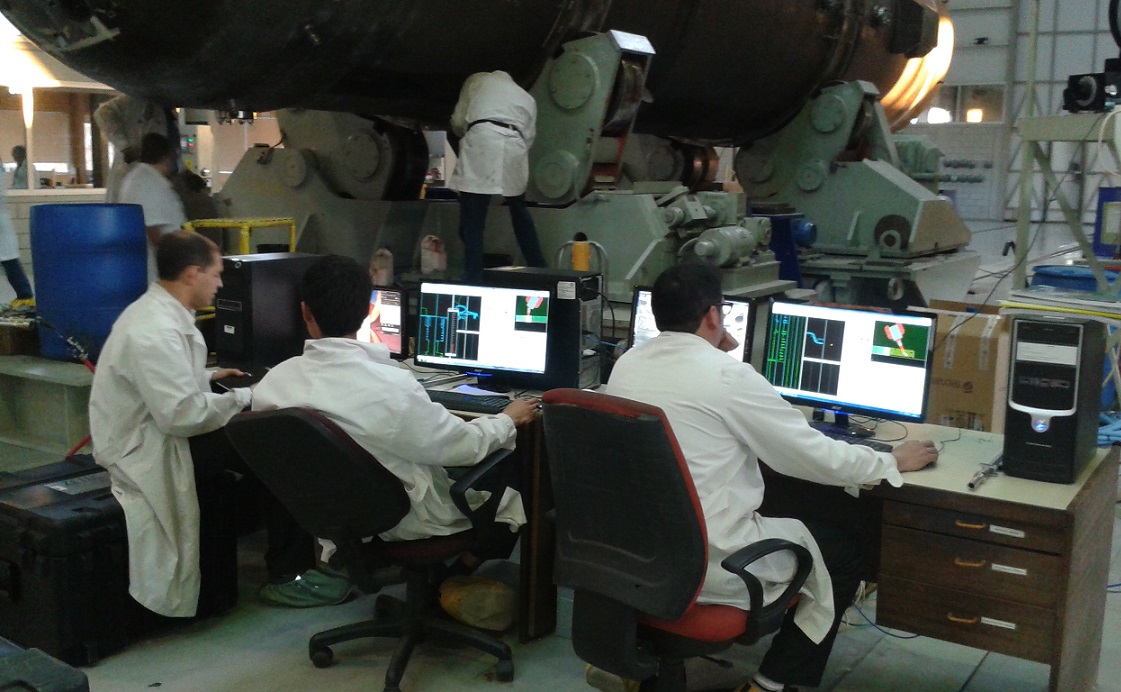
A typical heat exchanger eddy current inspection involves an acquisition crew of at least two people: one to handle the probe in the vessel and another to collect the data. After a number of tubes have been inspected, the operator copies the data to a memory stick or other portable device and sends it to the analysis workstation at another location or even off site.
When an analyst wants to review the inspection data for a tube, it might take several minutes to locate the file, open it up and process what he or she sees. Interpretations can vary depending on the analyst’s skill and experience, which can lead to unnecessary down-powers while engineers verify whether or not a tube should be plugged.
Automated analysis software is changing the equation.
Automated workflows
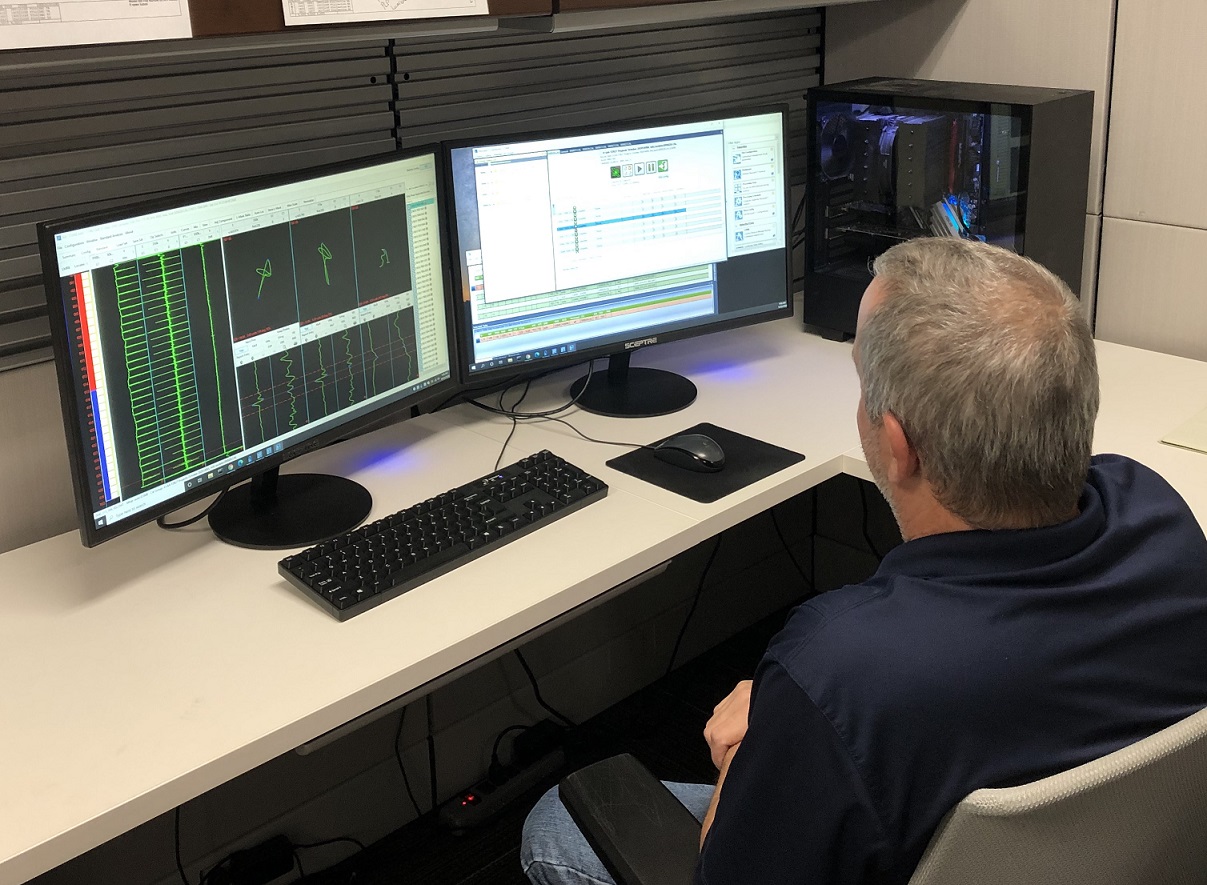
Developed specifically for heat exchanger inspections in power generation and industrial environments, automated analysis software integrates acquisition, analysis and reporting into a single workflow. The software analyzes the data as it’s being acquired by the probe operator, loads it into a data management system and can produce a report almost immediately. It can be used in a primary or secondary role or in a single-pass configuration for bobbin, rotating and array inspection techniques, and is capable of distinguishing between circumferential and axial indicators.
“It eliminates repetitive tasks and streamlines the process for evaluating signals of interest,” said Tom Bipes, project manager for Zetec’s RevospECT and Eddynet software business. “The software can significantly reduce the time from acquisition to reporting so the asset owner can make a more informed and timely decision about repairs and return to service.”
Efficiency and consistency
Brown described a public utility with a boiling water reactor where the condensers have roughly 12,000 titanium tubes in each water box—approximately 50,000 tubes total. Each tube is 55 feet long and has 15 support plates with a stake evenly spaced between them to help stiffen the tube bundle.
“We believed that some of these stakes were slipping out of position and sliding close to the support plate, putting circumferential stress on the tubes,” Brown said. “Under high-cycle vibration, tubes will relieve this stress by cracking axially or longitudinally.”
Brown’s team created a plan to map each stake’s location and monitor any movement from its original position as a way to identify high-risk tubes. “All told, we needed to map roughly 800,000 stake locations between two reactor units,” Brown said. He estimated that doing the work manually would take at least 2,000 man-hours, with a large error factor.
“Each inspector is going to measure a little differently, and the accuracy and approach of each individual is going to vary over thousands of measurements,” Brown said. “With automated acquisition and analysis, we could inspect 12 tubes at a time in about three seconds, looking for high-risk indications. In a matter of hours, we were able to give the customer a map of what we considered high-risk tubes caused by stakes that were not properly inserted or had moved. That’s impressive, and it added no time to our schedule or required nothing in the way of special skills or equipment.”
At a time when utilities are examining ways to reduce operating and maintenance costs to remain competitive, it’s often a balancing act trying to improve heat exchanger inspection data confidence and making an efficient operation run better. “Automation allows us to perform high volumes of tube inspections quickly with better accuracy and consistency,” Brown explained. “The savings from plant uptime alone translate to millions of dollars for our customers.”
Eliminating repetitive tasks
Zetec’s Tom Bipes recalled being contacted by an oil and gas processor about using automation to improve the efficiency, probability of detection and consistency of heat exchanger inspections at a remote refinery in Southeast Asia.
“Normally the plant operator’s inspection team would collect eddy current data, save it on one computer and then move to a different computer where another analyst would make a determination whether or not a tube should be taken out of service,” Bipes said. These steps typically took several hours; a final report was completed off-site and required another week or more.
“There was a 10- to 14-day lag from when the data was collected until it was analyzed and they had a final report in hand,” he said. The plant managers endured these delays because they felt their personnel did not have the experience to manually analyze and validate the inspection results on site.
“Automated analysis software produced results at the rate of acquisition, or around 15 seconds per tube,” Bipes explained. “Instead of a two-week turnaround, the inspection team had preliminary reports within an hour of completion.”
Furthermore, the process required one person whereas previously there were three.
“Qualified, experienced technicians and analysts are in high demand right now,” Bipes said. “Automated analysis allows them to focus on what they do best. It enhances the analyst’s abilities to identify potential indications and perform more inspections in the same amount of time without increasing costs.”
Historical comparisons
Computer-aided analysis and software tools such as noise measurement monitoring and the ability to review previous inspection results in parallel with the core analysis, which makes it easier to compare data from multiple inspections. NDE uses Zetec RevospECT HX Pro with HDC, or Historic Data Compare, to monitor changes over time. HDC automatically performs a full tube comparison of the current data to previous inspections and highlights indications of change. In a few seconds, an entire tube can be scrolled to view degradation in a true “apples to apples” view of inspection data.
NDE deployed HDC for its stake-mapping project. “We’ve done eddy current inspections at this particular power plant for three years straight,” said Brown. “With HDC, we can focus on those high-risk tubes to see if the stakes are continuing to move, and if so we can determine by how much. We could never have done this manually.”
Brown says the use of automated data collection and analysis allows NDE to be productive throughout the year.
“With our power-industry clients, the inspection windows are narrow and specific: one eight-week period in the spring, and another in the fall,” he said. “Automated analysis helps make my people available to do more work during those periods. This approach has given me the flexibility to match the manpower to the job and meet the needs of our customers.”


