Hydropower is continuing to grow throughout the US and its capacity increased by 1,688 megawatts between 2010 and 2019, according to the latest US Hydropower Market Report
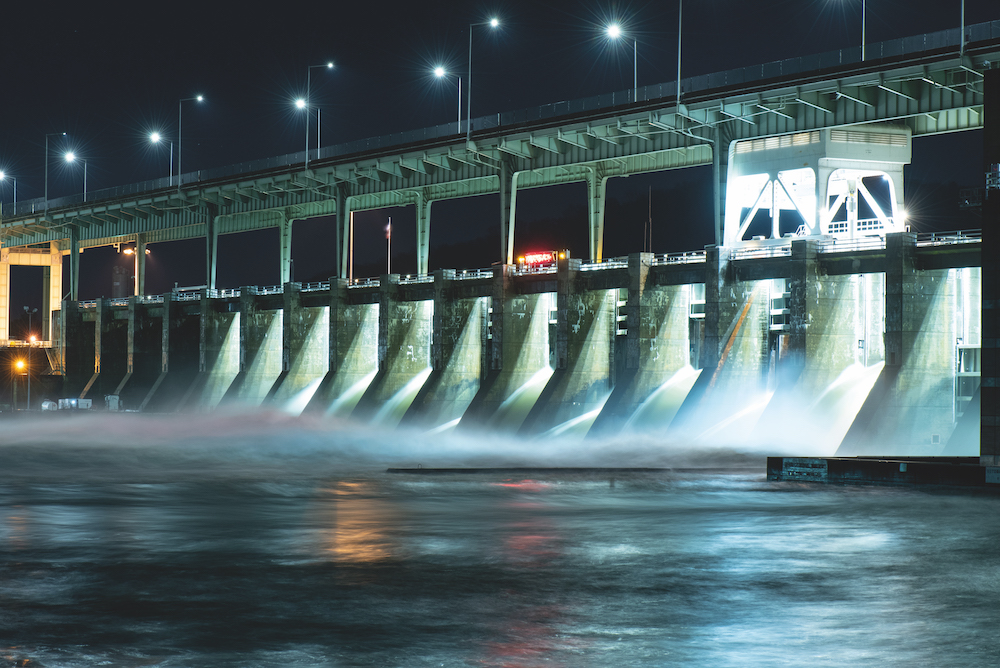
The 119-megawatt Chickamauga Dam on the Tennessee River was completed in 1940 (Credit: Shutterstock/Shot Stalker)
A noted lack of publicly available and easily accessible information about US hydropower led to the publication of the first US Hydropower Market Report in 2014. Seen as a valuable tool to help identify important trends affecting the sector, the third edition has been released by the Department of Energy’s Water Power Technologies Office. Here, International Water Power & Dam Construction (IWP&DC) magazine identifies the key takeaways from the report.
Globally, the US hydropower fleet represents 7% of hydropower capacity. In 2019, US hydro generated 274 terawatt-hours (TWh) of electricity, accounted for 6.6% of all electricity generated and 38% of the country’s electricity produced from renewables.
At the end of the year, 80.25 gigawatts (GW) of generating capacity were operational in 2,270 hydropower plants across the country.
The above information is compiled from the third edition of the US Hydropower Market Report, which was published recently by the Department of Energy’s Water Power Technologies Office.
The report states that hydropower continues to grow throughout the US and, since the publication of the last report (2017–19), hydropower capacity increased by 431 megawatts (MW) and a total of 1,688MW from 2010 to 2019.
Capacity added from new projects or upgrades to the existing fleet over the past decade (2,225MW) outweighed capacity reductions due to plant retirements or downrates (53MW).
Net increases took place in every region and over the past decade was primarily from capacity additions to the existing fleet (1,704MW). However, 562MW also came from new developments, which mostly added hydropower generation to non-powered dams and conduits.
As the report authors, Rocío Uría-Martínez, Megan M. Johnson and Rui Shan from Oak Ridge National Laboratory explain, hydropower in the US is used extensively for power system flexibility and resilience. Although it represents less than 6.7% of electricity generation capacity, it provides about 40% of black start resources.
In many parts of the country, hydropower provides more frequency regulation and reserves than its share of installed capacity and is more extensively utilised for hourly ramping flexibility than any other resource.
Pumped storage
Pumped storage is growing “nearly as fast” as all other storage technologies combined. Forty-three pumped storage plants with a total power capacity of 21.9GW and an estimated energy storage capacity of 553 gigawatt-hours (GWh) accounted for 93% of utility-scale storage power capacity, and more than 99% of electrical energy storage in 2019.
Almost as much pumped storage capacity was added from 2010 to 2019 (1,333MW), mostly from upgrades to existing plants, as the combined installed capacity of all other forms of the country’s energy storage (1675MW).
Apart from the Olivenhain-Hodges facility in California (42MW), the remaining increase came from upgrades to six existing pumped storage plants – Castaic in California, Northfield Mountain in Massachusetts, Muddy Run in Pennsylvania and South Carolina’s Bad Creek, Fairfield, and Jocassee.
In 2019, the number of pumped storage projects in the development pipeline increased by 31%. Sixty-seven new projects with a total proposed capacity of 52.48GW were in various stages of evaluation or development across 21 states at the end of the year.
Meanwhile, three projects to increase capacity by 119MW at existing schemes were ongoing. Twenty-one states have at least one new pumped storage project planned. Pennsylvania, Arizona, and California are the top three states by the number of pumped storage projects under consideration with 11, 10, and seven projects, respectively.
Development pipeline
Nearly 1.5GW of hydropower is in the US development pipeline distributed across 34 states. Half of this will add hydropower to existing conduit infrastructure (3% of proposed capacity).
More than two-thirds (69%) of the proposed capacity would come from retrofitting non-powered dams and another 25% from capacity additions at existing facilities.
Relicensing
Relicensing activity by the Federal Energy Regulatory Commission (FERC) is set to more than double in the coming decade, the report states.
Over the past decade, FERC issued 80 relicenses that extended project authorisation to operate for an additional 30 to 50 years; accounting for 17% (6.9GW) of FERC-licensed hydropower capacity and 37% (6.7GW) of FERC-licensed pumped storage capacity.
Upcoming in the 2020s, 281 licenses that currently authorise 12% (4.7GW) of installed FERC-licensed hydropower capacity and 50% (9.1GW) of FERC-licensed pumped storage are set to expire.
The number of hydropower plants with licenses expiring in the northeastern states (169) is greater than in all other regions combined. For 99 of those 169 projects, it will be their first relicensing process as they started operating in 1980 or later.
Uprating and refurbishment
Globally, North America leads investments in the uprating and refurbishment of hydropower plants. The US and Canada is the region with the oldest fleet, in terms of capacity-weighted average age, and is the region that spends the most on uprating and refurbishment projects worldwide.
At least $8bn has been invested in uprating and refurbishment across the US over the past decade, with almost $2bn being spent on projects initiated from 2017–19. The most common feature of such projects was the replacement or refurbishment of turbine runners and generator rewinds.
At the end of 2019, North America’s planned and ongoing investment in uprating and refurbishment totalled $11.6bn, distributed across plants that make up 36% of the region’s installed hydropower capacity and 19% of pumped storage capacity.
Turbine market
According to the market report, the US hydraulic turbine market remains diverse and robust. Almost 12GW of hydropower and pumped storage turbine capacity has been installed across the country since 2010.
Seventy-nine per cent of the 291 turbine installations went towards uprating and refurbishment of existing hydropower facilities and represented 96% of the turbine capacity installed.
Fourteen (5%) of installations are pumped storage turbines that accounted for 33% of installed capacity over the past 10 years.
Five companies (American Hydro, Andritz, GE Renewable Energy, Voith, and Toshiba) manufactured 92 turbines with capacities greater than 30MW installed in the US over the past decade. During 2017–19, at least 67 turbine units were installed in the US (about 3GW of combined capacity).
According to the report, the distribution of turbine types is significantly different for installations at new plants than for unit replacements.
Sixty-two per cent of unit replacements were Francis turbines (60% of capacity). For new projects, 72% (316MW) of installed turbine capacity since 2010 has been Kaplan units, the preferred turbine type for low-head non powered dam developments.
This article originally appeared in International Water Power & Dam Construction magazine