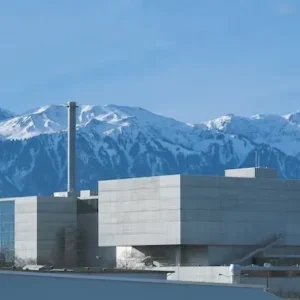
San Fernando earthquake is noted down in history as one of Southern California’s significant seismic events. Measuring a magnitude of 6.6 on the Richter scale, it occurred on 9 February 1971 and created a liquefaction failure at the Lower San Fernando dam and reservoir on the northern edge of the greater metropolitan Los Angeles area.
The earthquake shaking initiated a major failure on the upstream side of the dam and was perilously close to a catastrophe. A very steep slide head scarp and marginal freeboard remained after the event. Had the head scarp been slightly lower, the outflow from the reservoir would have quickly eroded the dam and flooded many communities downstream. Considering the extremely precarious situation, some 80,000 people over an area of 28.5km2 were evacuated while the reservoir was emptied over a period of three to four days.
San Fernando dam has become an important case history for geotechnical earthquake engineering. Due to its significance, the case has become the subject of years of research and numerous publications. Much of the early work was carried out by professor H Bolton Seed and his colleagues from the University of California at Berkley throughout 1975.
In light of this, Canadian software company Geo-Slope International has been keen to show how its products can be used to analyse such a case. The purpose was not to replicate all that has already been done or to necessarily adopt the exact conditions presented by others, but to illustrate the features and capabilities of the company’s suite of GeoStudio software products in the context of a famous case history.
GeoStudio suite
The GeoStudio suite encompasses eight CAD software products. These include:
• QUAKE/W – used for the dynamic analysis of earth structures subjected to earthquake shaking. QUAKE/W determines the motion and excess pore-water pressures that arise due to shaking. Generalised material property functions allow the use of any laboratory or published data and three constitutive models are supported (linear-elastic, equivalent linear and an effective stress non-linear model).
• SEEP/W is used for analysing groundwater seepage and excess pore-water pressure dissipation problems within porous materials such as soil and rock. Its comprehensive formulation allows analysis ranging from simple, saturated steady-state problems to sophisticated, saturated/unsaturated time-dependent problems.
• SLOPE/W – a slope stability product for computing the safety factor of earth and rock slopes. This can effectively analyse both simple and complex problems for a variety of slip surface shapes, pore-water pressure conditions, soil properties, analysis methods and loading conditions.
• SIGMA/W – can be used to perform stress and deformation analyses of earth structures. Its comprehensive formulation makes it possible to perform a simple linear elastic deformation analysis or a highly sophisticated, nonlinear elastic-plastic effective stress analysis.
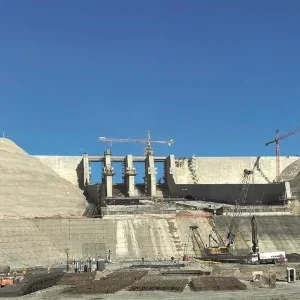
The above packages were used for the analysis of the Lower San Fernando dam. Constructed primarily by hydraulic fill placement, the dam was built directly on the stream-bed alluvium which is about 5m thick. As was noticed during investigations after the failure, the fill graded from coarse silty sand at the outer edges to a more clayey soil towards the centre of the dam. Standing at a height of 44m, the dam had 2.5h:1v side slopes, with the downstream side having a berm with a side slope of 4h:1v.
Using GeoSlope’s products the first step in the modelling process is to establish the long-term steady-state seepage conditions and pore-pressures. This can be done with SEEP/W. On the downstream side, the water table is taken to be at the ground surface or at the surface of the alluvium. A granular blanket was placed between the original dam and the downstream berm, and assuming that the blanket functioned as intended, the piezometric line will daylight somewhere in the granular blanket. This can be modelled by tagging the boundary between the dam and the berm as a potential seepage face.
Approximate conductivity functions and Ksat values are adequate for this steady-state analysis, since the piezometric surface is high up in the dam and much of the seepage flow is in the saturated zone. Also, the pore-pressure distribution is not sensitive to Ksat.
The next step is to establish the initial total and effective static stress distribution throughout the dam. This can be done with a QUAKE/W static-type analysis or a SIGMA/W insitu analysis. The QUAKE/W initial static analysis type is used here.
To compute the initial static stresses, it is necessary to specify Poisson’s ratio and the total unit weight of the soils. Poisson’s ratio is used indirectly to say something about Ko; the remainder of the specified material properties do not influence the insitu stress calculations.
Previously computed SEEP/W pore-pressures are used in the static stress analysis. It is important to include the weight of the reservoir water in the static stress analysis and is done by applying a fluid pressure boundary on the region edges in contact with the reservoir.
As a reference point, it is useful to know the factor of safety under static conditions before the slide occurred. Based on the SEEP/W pore-pressures and QUAKE/W static stresses, the factor of safety is between 2.14 and 2.19 and is consistent with the findings by Seed el al, who concluded that the margin of safety against instability under the static conditions was fairly high.
The next step is to do a dynamic analysis using QUAKE/W to determine the excess pore-pressures that may develop, and identify zones where the soil may have liquefied or where the soil strength may have dropped down to the steady-state strength.
The equivalent linear method of analysis in QUAKE/W is formulated to compute the generation of excess pore-pressures on the basis of cyclic stress ratios (CSR), and on the basis of the number of uniform cycles experienced by the soil during the shaking, relative to the number of cycles required for the soil to liquefy. Two pieces of data have to be specified for this system. They are a cyclic number function and a pore-pressure ratio function.
Assuming that the earthquake shaking produces the equivalent of ten uniform cycles of shaking, this is the number of cycles the dam will experience. Therefore, if the CSR is 0.3 or greater, the soil will liquefy; that is, fewer than ten cycles at a CSR or greater will produce liquefaction.
Figure 1 shows contours of q/p? stress ratios under the initial static stresses. A point of significance is the high q/p? ratios in the central part of the hydraulic fill. This means that there is a zone where the initial q/p? points are above the collapse surface. The soil strength in this zone could easily fall down to the steady-state strength with a small amount of shaking. With Css = 30 and the inclination of the collapse surface at 20 degrees, stress ratios greater than about 0.9 indicate a stress point above the collapse surface. The yellow shaded area in figure 2 is the zone where the stress ratios are initially above or on the collapse surface. In QUAKE/W this is flagged as a liquefied zone.
During the shaking, excess pore-pressures will develop, causing other elements to reach the collapse surface as discussed earlier, or in other words, to liquefy. Figure 3 shows the liquefied zone at the end of the shaking.
Of great significance is the shape and location of the liquefied zone on the downstream side. The shape and location is not unlike what Seed et al determined what actually happened. They came to the conclusion that, in all likelihood, there was a tongue-shaped zone in the lower position of the hydraulic fill that was at the root cause of the liquefaction and subsequent instability. The QUAKE/W liquefied zone on the downstream side in figure 3 is somewhat similar.
The liquefied zone in the core area is different than what Seed el al believed to be the case. However, in light of more recent research that has led to the concepts associated with a collapse surface and the impact that stratification may have had, as discussed earlier, it is not unthinkable that there was also a major strength loss in the core area. The QUAKE/W results suggest that this may have been the case.
In relation to post-earthquake stability SLOPE/W has the capability to use the specified steady-state strength Css along the portion of a potential slip surface that passes though an element that QUAKE/W has marked as liquefied. Repeating the pre-earthquake stability analysis, but with post-earthquake pore-pressures and with Css strengths in the liquefied zones, results in a factor of safety of less than unity (1.0), which clearly was the case.
Figure 4 shows the cohesion and friction angle along the critical slip surface. Note how the cohesion jumps to 30kPa and the friction angle drops to zero where the slip surface passes through liquefied elements (the toe is on the left and the crest is on the right).
Post-earthquake deformations
There is strong evidence that the major slide movements did not start until after the strong earthquake shaking. Seed et al note that the slide probably did not occur until near or just after the end of the stronger earthquake motions. The significance of this is that the inertial forces (mass times acceleration) had already vanished by the time the slide movement started. This being the case, the cause of the slide was the excess pore-pressures and the associated strength loss – not the inertial forces.
The post-earthquake conditions can be taken into SIGMA/W to do a stress re-distribution. Clearly some zones were over-stressed after the earthquake due to the strength loss. With SIGMA/W, it is possible to attempt to re-distribute the stresses in the over-stressed zones. Such a stress re-distribution generally is accompanied with deformations, especially when the overall structure approaches the point of limiting equilibrium. In this case it has already been shown that the structure was past the point of limiting equilibrium, but a stress re-distribution analysis can nonetheless provide some information about the failure mechanisms.
Figure 5 shows the displacement vectors from the post-earthquake SIGMA/W stress re-distribution. The movements seem to be a reasonable approximation of what happened as the movement started. In the crest area the start of the movement is close to where the head scarp was and the movements are downward at a steep angle, which is consistent with the actual head scarp. On the left side, much of the movement is more or less horizontal, which is also consistent with the observations presented in the published literature.
This analysis of the Lower San Fernando Dam case history demonstrates the advantages of product integration within the GeoStudio suite. Many of the material properties used in this analysis are simple estimates but are adequate for understanding the key issues and mechanisms. This is also true for any project. It is good modelling practice to first use realistic estimates of material properties to obtain an understanding of key issues. Then a decision can be made as to where additional efforts and resources should be spent on further field investigations and testing.
A full-length technical article by GeoSlope can be found on the company website at www.geo-slope.com
San Fernando dam update
Damage from the San Fernando earthquake meant that a replacement dam was needed. The US Geological Survey (USGS) recommended the new dam be designed to withstand shaking about three times stronger than that assumed in design studies prior to USGS consultation.
The new US$33M Los Angeles dam was built in 1975-76 up the valley from the old Lower San Fernando dam. The old dam was not dismantled but reconstructed ( not to USGS shaking estimates) to provide a holding basin for storm water and to back up the new dam.
Two decades later, the 1994 Northridge earthquake put the Los Angeles dam to the test. The Northridge earthquake was almost equal in magnitude to the previous San Fernando earthquake. Ground shaking was very strong, with amplitudes among the highest ever recorded but consistent with the USGS estimates. Yet the dam showed only minor deformation and superficial cracking. Despite the intense shaking, the crest of the dam moved only 2.5cm sideways and settled only 8.9cm. In contrast, the Lower San Fernando dam again suffered heavily. Cracking and movement seriously damaged the upstream slope. Had the old dam been holding as much water as it had in 1971, the damage would have been far greater–at least equaling that from the 1971 earthquake.
Source: Robert A. Page, David M. Boore and Robert F. Yerkes. www.usgs.gov