
WITHIN the hydro power industry, turbines are considered one of the most expensive pieces of equipment to maintain, with failures rarely single mode events. Normally, turbine deterioration leading to a failure is a slow process involving the interaction of many cavitations, mechanical looseness and abrasion, local overheating, and other conditions. The failure condition signals are generally acquired via some universal sensors such as temperature, pressure, vibration and so on, which need to be placed above the monitored part of the turbine. However, there are some cases that will not satisfy the above condition, i.e. monitoring the cavitations or the frictions between the turbine shaft and the guided gearing. Acoustic emission (AE) is a physical process that is one of many reflections of the machine health failure. Recently, AE measurements have successfully been used to detect defects in rolling element gearings [1-4]. The main advantage of using AE monitoring is that the measurements can be performed at a distance from the machinery, avoiding a safety risk and eliminating the need for some sensors with their associated mounting considerations.
Generally, according to AE dynamic characteristics of turbines, the turbine noise sources can be classified into the following three categories: cavitations [5-7], frictions or impacting, and random sources. The cavitations erosion sources are usually connected with the alternation generation of individual bubbles or topological structures of gas phases in liquid, whose responses would extend more than 20kHz. The impacting or friction sources are related to mechanical faults, friction and collisions between mechanical parts such as guide vanes and runner blades, the turbine shaft and its surrounding stationary components etc. Some of the impacting noise sources are also generated by the turbines adjustable blade-slap, valves and its seat. The random sources exist in almost all kinds of machines. Particularly in turbines, the measurements via AE are often affected by interference from these random noise sources.
Cavitations in an operating turbine are a ubiquitous phenomena which can occur during the commissioning of a new unit or after refurbishment in which turbine parts, such as runner blades or wicket gates, are modified or repaired. The only way to assess the intensity of cavitations in an operating turbine and gain an insight into its condition is to listen to cavitations. Cavitations produce an acoustic field that is transmitted from the water to the turbine’s dry shell and conveys information on the cavitations flow and the erosion it causes. Cavitation monitoring via vibro-acoustic method in Kaplan, Francis and Bulb turbines has been consummated and elaborated by Bajic [5-7].
Monitoring impacting or friction measures via universal sensors such as vibration or accelerometer is sometimes difficult, partly because of the sensors locations. However, the measurement of these via acoustic method should be relatively simple – you can mount several acoustic sensors around the potential problem areas. There may however be some influences on the acoustic signal from ambient and background noise. This may require a lengthy calculation time.
In this study, the authors propose a latent faults source detection system using AE sensors based on discrete wavelet transform (DWT), which is applied to monitor the impacting, frictions and collisions AE between the turbines shaft and the water guiding gearings.
Discrete wavelet transform
Typical features extracted from signatures in condition monitoring include time-domain, frequency domain and time-frequency domain methods. Time-domain involves descriptors such as peak level, root-mean-square (RMS) value, kurtosis analysis, and pulse count. These conventional time-domain analysis methods are sensitive to impulsive oscillations, but have limited use in extracting hidden patterns and frequency related information in the AE signals. This problem is partially overcome by spectral (frequency) analysis such as Fast Fourier Transform (FFT), which is often used as a technique for analysing the periodicity of certain time-axis signals. However, no clear differences between normal and abnormal sound signals were observed in the spectrum expressed via the FFT. This is considered to be because characteristic signals which are present transient in time are averaged out, while the background noise is superimposed on the sound generated by the turbine, which results in the signal-to-noise ratio(SNR) of the sound components used to monitor whether the fault occurring is very low. Those factors make acoustic monitoring difficult using conventional FFT technology. In recent years, time-frequency methods such as wavelet-based multi-resolution analysis have gained popularity in analysis of both stationary and non-stationary signals. These methods provide excellent time-frequency localised information, which is achieved by varying the aspect ratio. Hence, time and frequency localised features are analysed simultaneously and the scheme is more adaptable to transient signals.
In order to use wavelet transform in PC-mode, DWT must be employed but not the continuous wavelet transform (CWT), the mother wavelet could be employed for feature discovery only when the mother wavelet is close enough to the feature components hidden in the original signal.
The DWT is defined as follows:

where t is the time, f(t) is the acoustic signal, j is a scale and b is a scale variable. The w(t) is defined in the following equation whose outline frame looks much like an AE signal.
? (t) = e-pt2 cos (2?ft)
Where p is a positive value and f is a frequency.
In this paper, the parameters are set to p=8000 and f=20kHz which is the top frequency of audible sound. Since the authors chose j=0,1,2,3,4,5, the center frequency for each j is 20kHz for j=0, 10kHz for j=1, 5k Hz for j=2 and so on. The DWT has the property of the constant-Q filtering, that is, the ratio of the center frequency to its bandwidth is constant.
AE monitoring system
The structure of the AE monitoring system is shown in Figure 1. The system mainly consists of three parts, namely: acoustic signals data acquisition station (DAS), turbine diagnosis server and turbine diagnosis mobile server. DAS perform transforming analogy acoustic sensor signal to digital signal, which is composed of acoustic sensors, one DSP unit including a SRAM chip and a 12-bit ADC. The SRAM includes 18k words onchip and an extensional 2M words fast memorises to memory the temporary digital signal. The turbine diagnosis server performs feature extraction of acoustic signals based on DWT, and stores and analyses acoustic feature information. Moreover, an expert knowledge base was constructed and employed to decide the fault type and location of the AE sources. One modern portable PC is employed as the turbine diagnosis mobile station to monitor the condition information of turbine health and make some diagnosis online. The data communication between the turbine diagnosis server and DSP are performed via CAN agreement, while the turbine diagnosis server and the turbines diagnosis mobile station is via TCP/IP.
Condenser microphone sensor
Four commercially available condenser microphone sensors AWA14423 and four preamplifiers AWA14602 made in china were employed as sound collectors, which had a noise specification of less than 2µV plus a switchable gain 40/60dB, with an operating frequency ranging between 20Hz and 50kHz at temperature ranging from 0º to 65º and can provide two 1/2 inch phase matched condenser microphones. The sound signal was converted to a sound intensity via the sound level meter, and the voltage output (AC 5V at full scale) corresponds to the sound level in dB. They were
positioned around the turbines shaft away at a distance of 200mm from the water guiding gearing, and as near as possible from the data acquire unit to make the signal cable as short as possible to reduce the acoustic signal attenuation.
Central process and data acquire unit: DSP
The authors selected the TMS320F2812 DSP from Texas Instruments as the operational processor. The new fixed-point 32 bit DSPs can offer 150MIPS, a single cycle 32 x 32 bit MAC capability, and an on-chip 12bit ADC, supported by a virtual floating-point math library that significantly eases the development of a multitude of applications and can keep the entire acquisition system within one unit. On the other hand, with only a CAN controller onboard, the authors mounted a CAN transceiver on the DSP system, and the Philips CAN transceiver PCX82C250T was employed which is powered by DC +5.0V.
Optimisation of the data communication and transform
In practice, the data quantities of the sampled acoustic signal are very large, it is impossible to move all the data to memory inside the DSP,
For this problem, the authors designed a parallel procedure structure of data movement and data commutation. First one buffer of 16k words is allocated in memory on chip, the data movement is then performed by the DMA, which can transform data between points in the memory map without intervention by the CPU. The DMA allows data movements to and from internal program/data memory, and the internal peripherals, such as the McBPs (multi-channel buffered serial port), which will shorten the time of data movements. Secondly, the extended memory SRAM is divided into two 800k word buffers, respectively buffer 0 and buffer 1. Buffer 0 is employed for transforming data between memory on chip and extended memory outside DSP, buffer 1 for the data communication between the DSP and the turbine diagnosis server via CAN.
Result and analysis
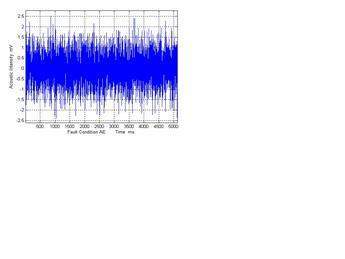
A system experiment has been tested on the 19th turbine set (125MWA) at the Gezhouba water and power plant in China’s Hubei province. In the experiment fields there is a turbine shaft, runner blades servomotor and operating ring etc. Four AE sensors were positioned around the turbine shaft at +X,-X,+Y,-Y directions and near the water guide gearing at a distance of 200mm. The specifications of the AE sensors and the A/D converter are shown in Table.1. During the AE signals acquisition, a trigger level was set above the acquisition system’s electronic level (0.005v) and a pre-trigger duration of 32µs was employed. In addition, the acquisition system employed an anti-aliasing filter with a 3 dB roll-off at 1MHz and a frequency band filter between 20Hz and 20kHz. The authors sampled 5120 points data for every revolution of the turbines. Figure 3 shows the experiment result.
Figure 3 and Figure 4 show the AE signals from the test fields. Figure 3 is the normal signal without any friction or impacting which was recorded on the normal operating condition with good lubrication between the turbine and guide gearing, but Figure 4 is the abnormal one with the friction between the turbine shaft and guiding gearing with bad lubrication. When you came near the AE fields, you could hear the light friction sound. Despite using one high frequency filter over 200kHz, which thresholds are taken as two-fifth the maximum of the signal, the SNR of the acquired signal is still very low. However, you could not distinguish between them because the two AE signals were seriously immersed by heavy background noise.
Figures 5 and 6 are the result of wavelet analysis using Morlet Mother wavelet decompose with DB5, and the layers of DWT was selected L=5. Using the de-noising method based on the DWT, the authors can approximately remove some noisy components and are able to find some differences between the two AE signals in rhythm and timbre whose thresholds are taken as two-fifth the maximum of the signal – the reasons for this selection is that the SNR of the signals are low. Some sharp differences exist from the two purified signals which proved that the aberrance is exposed after performing de-noising. Figure 6 has some aberrant impulses resulting from some impacting or friction faults, which may have occurred because of the overhaul, overheating or bad lubrication conditions between the shaft and its surrounding stationary components.
Figure 7 and Figure 8 show the respective power spectrum – it can be seen that the normal AE signal has one domain frequency, while the fault has none and is disorderly and unsystematic. It should be pointed out that the data sampling frequency is not high because of the limitations of DSPs storage space and the ADC specifications on the chip of TMS320F2812, but it does not affect the qualitative evaluation.
It is known that the noise field around a machine shows variation with direction, time, acoustic environment, operating and mounting conditions. Under such circumstances, the position of the microphone and its proximity to other components (acoustic sources) play a critical role in the successful application of AE monitoring. In this test, the microphone was positioned 200mm away from the turbines shaft. Initially, various measurements were taken at a distance of 200-600mm. Results from all these acoustic measurements revealed the fault features of the turbine shaft, but the results, based on 200mm, illustrate much clearer fault symptoms. Therefore, it can be concluded that small variations in distance can still give good results. Larger variations in distance, such as 800-1000mm, however, gave worse results. The fault features, which were identified clearly in small distance measurements, disappeared very rapidly with the increasing distance of the microphone. This is due to the fact that sounds from other sources become more dominant in the acoustic signal and it is more difficult to extract the acoustic characteristics of the turbine when the acoustic signal is more contaminated.
In AE monitoring, the high level of noise contamination has been the fundamental hurdle to be overcome. In this study, the background noise level has been randomly altered between 30 and 35 dB to simulate variation in the background noise. This took place in a workshop with some adjacent machinery in operation. During the acoustic measurements, operating conditions (speed and load) of turbine remained constant. Therefore, any significant change in acoustic characteristics of turbines can be attributed to turbine conditions. In a natural industrial field. The pattern of background noise and its variation are more complex and therefore further tests should be conducted in either an actual industrial field or with a better-simulated industrial field.
Conclusion
A latent friction or impacting faults detection system via AE sensors between the turbine shaft and its surrounding stationary components was proposed in this case study. The DWT technique of AE signals processing was employed to analyse the characteristics of the transient AE by some frictions or impacting, and locate the AE sources between them. This AE monitoring system has been in service in China’s Gezhouba water and power plant. The application results demonstrated that AE is very effective for the early detection of latent faults and may provide a powerful tool to indicate the various types of progressing faults, acting as a cost-effective, nondestructive technique for detecting and locating potential problems.
Author Info:
The authors are Daohu Wu and Zhaohui Li, College of Hydropower and Information Engineering, Huazhong University of Science and Technology, Wuhan 430074, R.P.China, Email: daohu_wu@yahoo.com.cn
TablesTable 1


