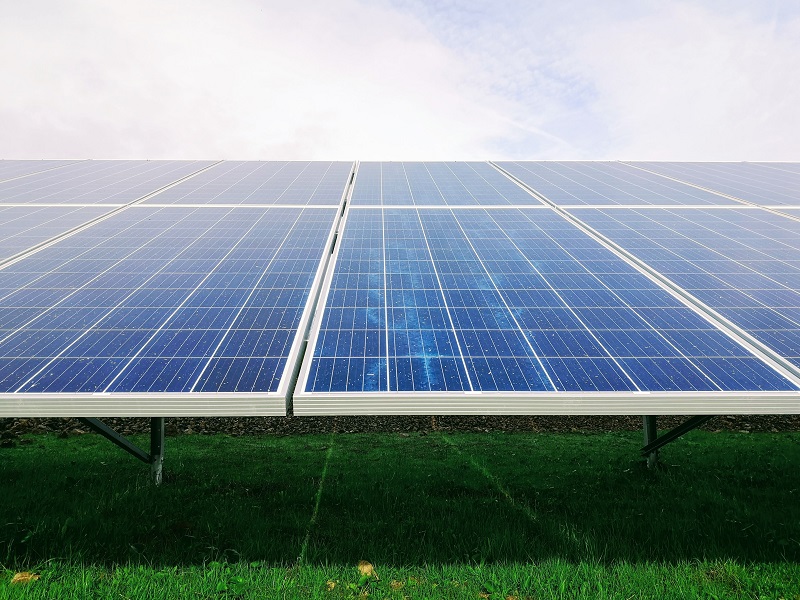
The UK features in the top 10 global markets for solar PV and has enough capacity to power more than 900,000 homes. The renewable energy is being generated by more than half a million households across the country.
The UK’s feed-in tariff scheme allows users to get payments from their energy supplier if they generate their own electricity through solar panels.
In 2014, a study revealed that UK businesses could collectively save more than £5bn a year in electricity bills by installing fully-funded rooftop PV systems on commercial roofs.
A total of 13,421 megawatt (MW) solar capacity has been installed as of February 2020, representing an increase of 2% when compared to the same month in 2019. Nearly 45% of total installed solar PV capacity currently comes from 464 large-scale installations.
Earlier this year, the UK’s Solar Trade Association urged the government to deliver a budget that unlocks the potential of solar energy in the country and empowers the transition to net-zero greenhouse gas emissions.
Top five solar power-producing counties in the UK
NS Energy profiles top five counties in the UK according to their total installed solar capacity.
1. Wiltshire: 614MW
With a total installed capacity of 614MW, Wiltshire leads the ranking of solar counties in the UK. Wiltshire, which features high downland and wide valleys, has large volumes of non-domestic capacity and more solar capacity installed than any other county.
In April 2008, changes made to Wiltshire’s planning system enabled solar panels to be erected without the need for permission.

2. Cornwall: 512MW
Cornwall, which is one of the sunniest counties in the UK, ranks second with 512.83MW total installed solar generation capacity. The county ranks first for both domestic and commercial solar penetration when the number of households is considered.
Cornwall’s planning guidance for renewable energy features detailed guidance on specific considerations, such as landscape and cumulative impact especially for solar farms and wind turbines.
3. Devon: 500MW
Devon ranks third in the solar power rankings with 500.74MW of total installed solar generation capacity.
Devon County Council has pledged to be carbon neutral by 2030, by installing solar panels on its assets and purchasing renewable energy direct from new solar power projects in the county.
The council also seeks to further reduce its carbon emissions by enhancing the energy efficiency of county council buildings.
4. Somerset: 457MW
Somerset ranks fourth with 457.29MW of installed capacity. Nearly 50 large-scale commercial developments in the county contribute 233MW of capacity.
A photovoltaic array (solar panels) installed at Somerset County Council’s main office at County Hall, Taunton, features 120 cells generating up to 19,000 kilowatt-hours (kWh) of electricity per year.

5. Hampshire: 409MW
Hampshire ranks fifth in the solar power rankings with 409.71MW of installed solar capacity. Commercial installations account for about 80% of capacity.
Hampshire County Council’s local authorities support in meeting their statutory requirements for planning and carbon emissions reporting. It develops and implements projects that decrease energy costs and carbon emissions.


