For the past decade, the median capacity factor of the global nuclear fleet has stayed constant at 85% — even though best performers consistently achieve much higher. The World Nuclear Association (WNA) understands that improving plant performance is essential in helping to realize the full potential of the industry. It formed the Capacity Optimization Working Group (COWG) in 2008.
The prizes at stake are large. Any increase in capacity factor positively affects plant economics, drives down CO2 and other atmospheric pollutants, and can improve public acceptance of nuclear power as a reliable energy source. It also reflects enhanced management control of work processes, which can result in increased plant safety.
Late in 2012 the group released the second edition of its report ‘Optimized Capacity-Global Trends and Issues’. This report draws on data from the IAEA Power Reactor Information Service database to present a snapshot of the performance of the world’s nuclear power reactors. The data collection period (ending December 2010) happens to exclude the Fukushima Daiichi accident, although the effects of this will certainly be accounted for in the next edition of the report.
The main performance indicator considered in the report is capacity factor (often referred to as load factor), defined as the ratio of the energy a unit produced over the period compared to the reference energy generation over the same time period. The report also analyses unavailable capacity and outlines the major causes of capacity loss.
Capacity factor trend
Figure 1 shows that in the 20-year period 1980-2000 there was almost a 20% rise in the median capacity factor, culminating in 2002 in a historical maximum of 86%. However, since then this growth has levelled off and the median capacity factor has remained constant at around the 85% mark for the last ten years.
It is important to note that there is a broad spread around that figure. In some cases, capacity factors of individual plants vary widely from the worldwide median. Generally, this variance is not explained by reactor type or age. Best performers represent a range of technologies, vendors, ages and regions; performance is not fundamentally limited by these factors.
Figure 2 shows that there is effectively no difference between boiling water reactor (BWR) and pressurized water reactor (PWR) capacity factors over time. This is despite the fact that the ageing mechanisms, chemistry performance, standard equipment, and operations are very different between these technologies.
Performance of GCRs has varied significantly, mainly due to type-specific plant ageing issues, as opposed to operational issues. The 2010 capacity factor of 77% is a pronounced increase on the 2008 value of 62%, is mainly due to the end of boiler inspection and modification work which took place during 2007 and 2008 in several AGR units. As for the other type of graphite-moderated reactor, LWGRs have increased their availability significantly over the last few years.
In general, no significant global age-related trend in capacity factor can be detected from Figure 3. This is good news for older plants, which can maintain historic output levels, and also for newer plants, which do not appear to require any ‘run-in’ time, suggesting that industrial good practice in operations is being passed on. It is uncertain whether genuinely new designs will benefit from this. There may well be a learning curve for the first couple of units.
What cannot be seen here is the financial cost of keeping older plants performing at historic levels, and whether this cost is comparable with the cost of operating younger plants. It is also suspected by COWG that there will be hidden trends within Figure 3.
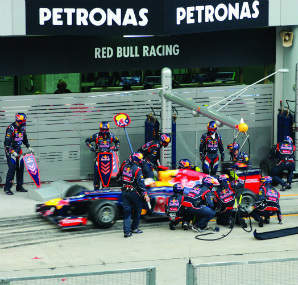
Pit stop performance
Those units in the top 10% consistently record capacity factors around the 95% mark, suggesting that there are clear gains to be made for the rest of the global fleet.
Planned outages (around 67% of all outages in 2006-2010) are the single most important area where performance improvements can be realized. Another one of the biggest causes of energy loss (9%) is an extension to a planned outage — suggesting that the best outages are not only short, but also well-planned and executed.
Crucially, outage scope does not have to be cut and therefore risk does not have to be transferred onto the operating cycle. Greater efficiencies can be achieved by lower-performing units in this area.
It is the experience of the group that there is much low-hanging fruit (small-scale changes) within the reach of most operators that will result in meaningful outage gains without requiring regulatory changes.
Figure 4 demonstrates that a high-performing plant is a safe one; increasing capacity factor correlates with a reduction in automatic scrams. Efficient management of daily work activities as well as effective preventive maintenance plans translates into improved overall quality of operation and enhanced safety.
Getting in the race
Differences in nuclear reactor performance around the world (Figure 5) are not necessarily understood. This is the basis for COWG’s ongoing work. The first step along the path to improvement is understanding these differences.
Regions and countries may have some restraints imposed upon them by local conditions, such as fuel supply issues, load following or seasonal demand variations. However, all countries can look to continuously improve performance within these boundaries.
Furthermore, if the trend towards globalization continues in the nuclear industry it will reduce the importance of reactor nationality.
COWG meetings (free for WNA members) bring together operators, vendors and maintenance specialists. They take place three times a year and serve to facilitate global industry cooperation on all aspects of operations, maintenance, and outages; to highlight innovation in technology and management practice that can improve plant performance and economics; and as a hub for the international exchange of experience.
There is not yet a magic formula that will transform plant performance overnight, but participation in COWG and sharing expertise is a good first step.
This article is based on: ‘Optimized Capacity: Global Trends and Issues 2012 edition,’ a report by the World Nuclear Association’s Capacity Optimization Working Group (http://tinyurl.com/cowgreport2012)


