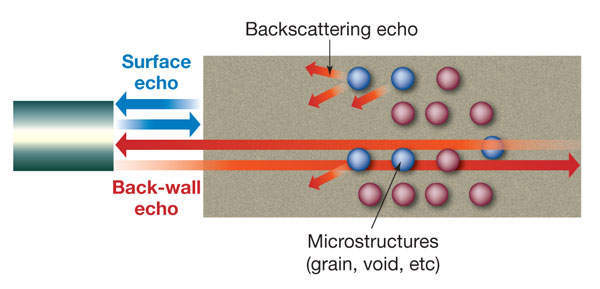
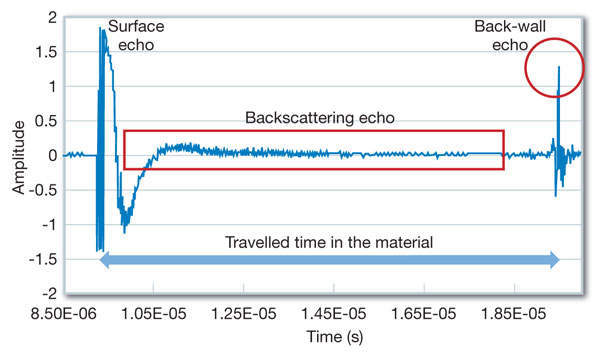
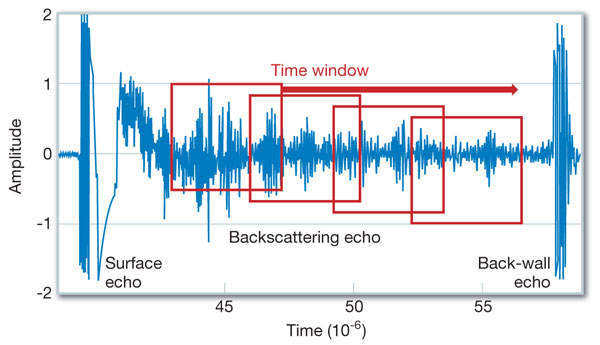
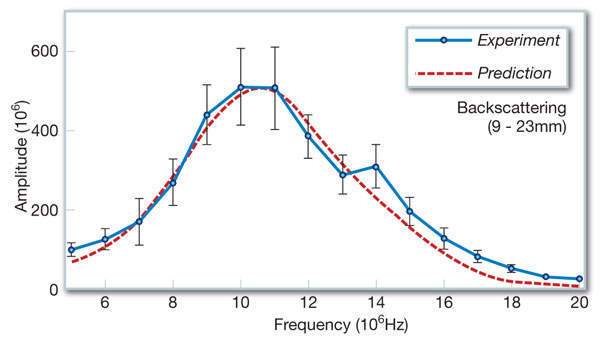
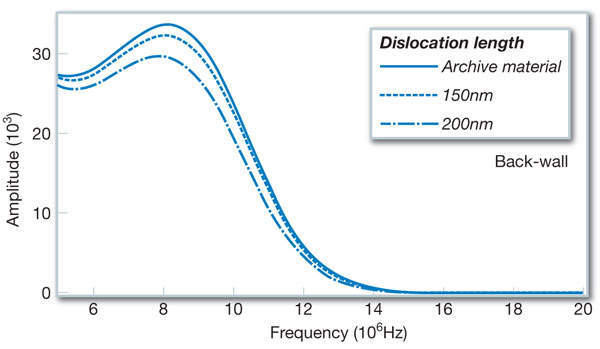
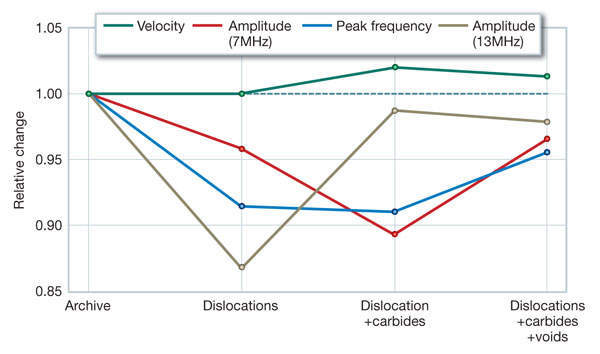
Using UT to assess neutron-induced damage
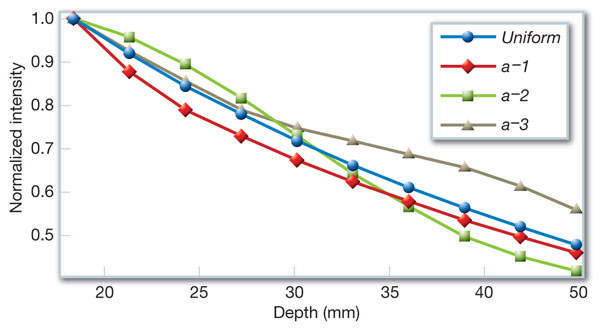
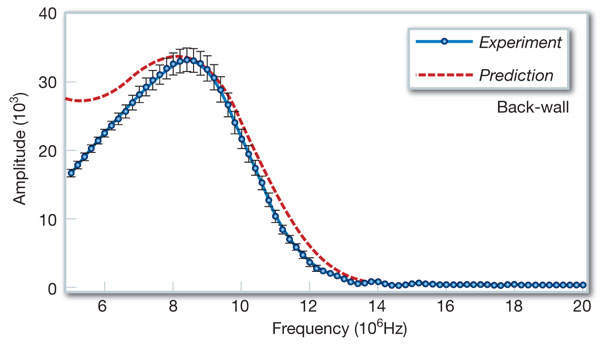
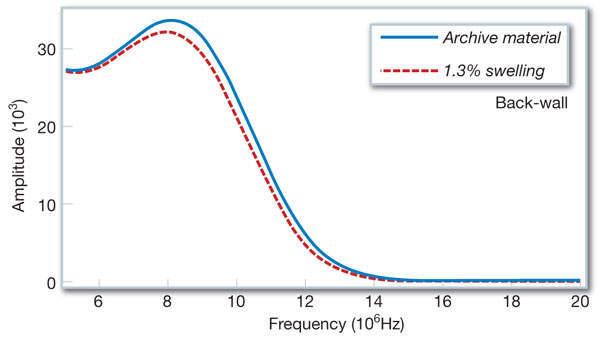
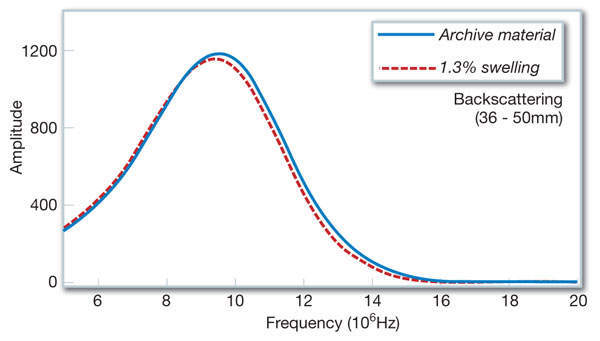
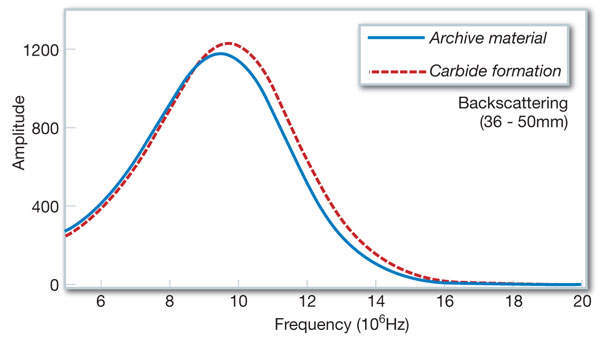
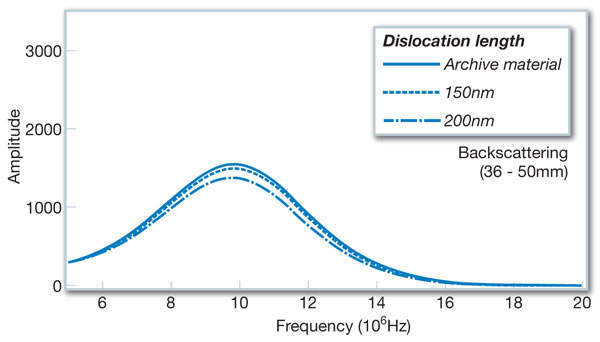
Figure 10: Frequency spectrum change in the backscattering echo in the region of 36-50mm from the surface due to dislocations
We use them to give you the best experience. If you continue using our website, we'll assume that you are happy to receive all cookies on this website.
ContinueLearn More X
Figure 10: Frequency spectrum change in the backscattering echo in the region of 36-50mm from the surface due to dislocations