Uncertainty and the breach of Gasper dam
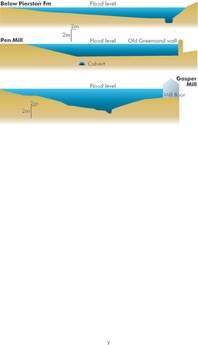
Figure 4: Valley cross sections downstream of Gasper dam
We use them to give you the best experience. If you continue using our website, we'll assume that you are happy to receive all cookies on this website.
ContinueLearn More X
Figure 4: Valley cross sections downstream of Gasper dam