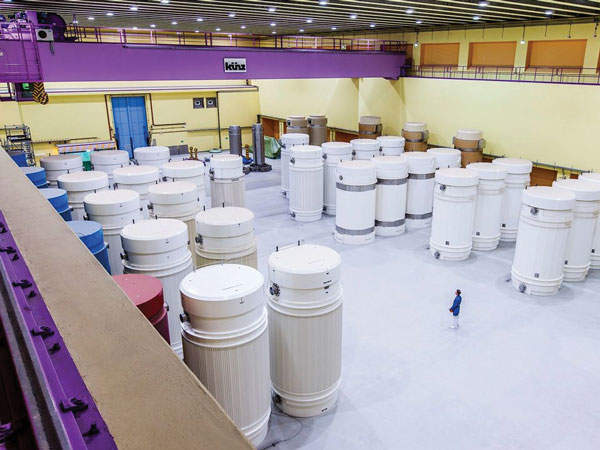
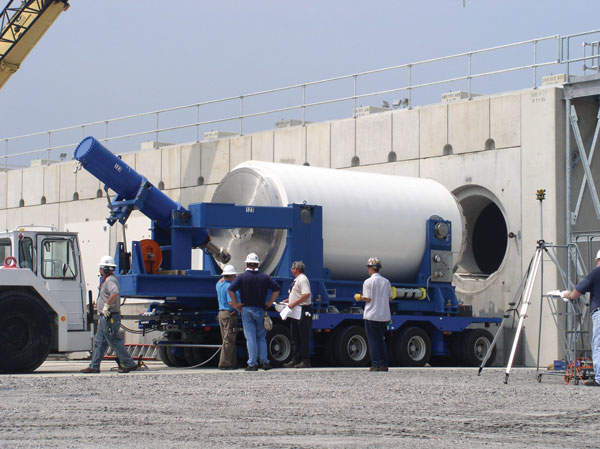
Transport of spent fuel after dry storage
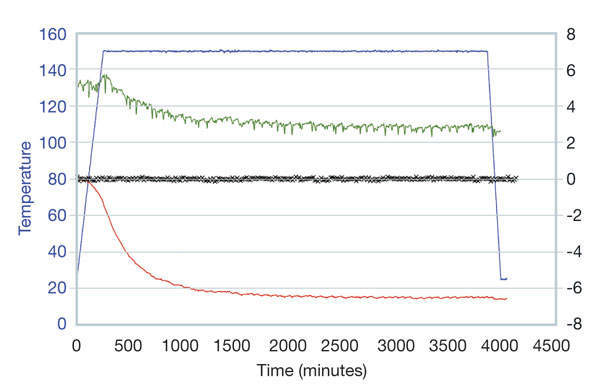
Fig. 4: Isotherm analysis at 150 °C coupled with gas analysis of a 25µm thick ZrO2 layer formed onto Zr4 fuel cladding (350°C, 155 bars) after 3500 hours of pool immersion. The graph shows water (green) and hydrogen (black) release rates, and cumulated global cladding mass loss (red) in arbitrary units (a.u.) as function of temperature (blue) and time.