Transport of spent fuel after dry storage
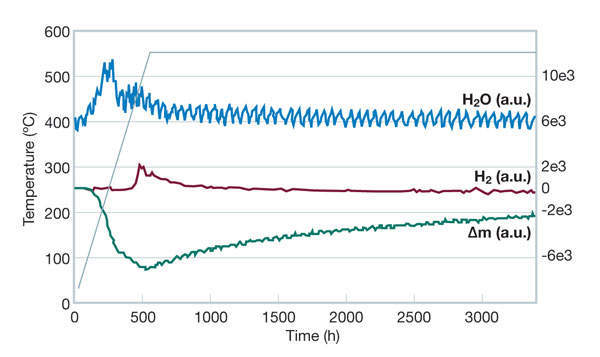
Fig. 1 Thermogravimetric analysis (TGA) coupled with gas analysis of a 25µm thick ZrO2 layer formed onto Zr4 fuel cladding (350°C, 155 bars). The graph shows water and hydrogen release rates, and cumulated global cladding mass loss in arbitrary units (a.u.) as function of temperature and time.