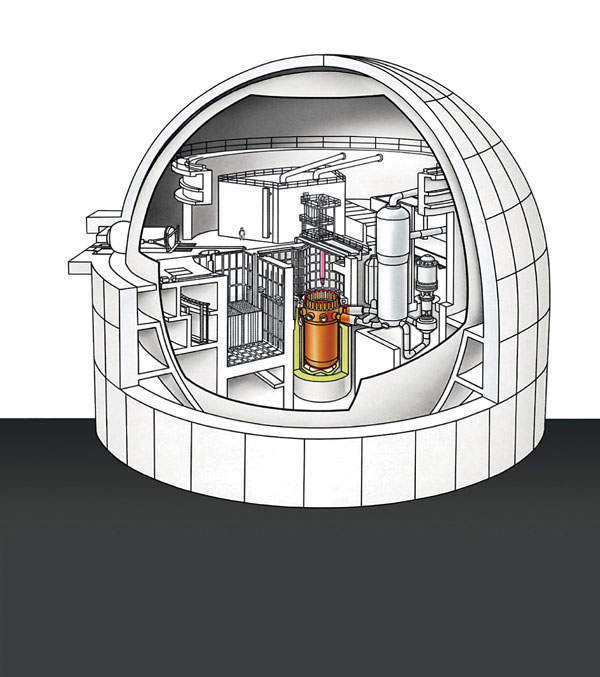
The Biblis activity atlas
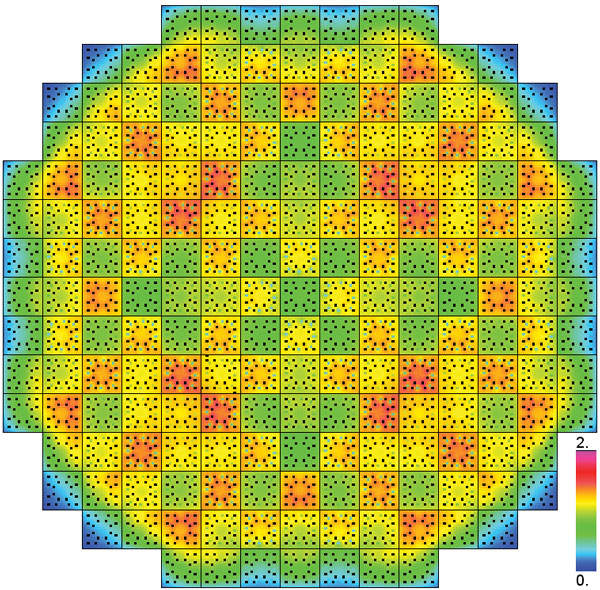
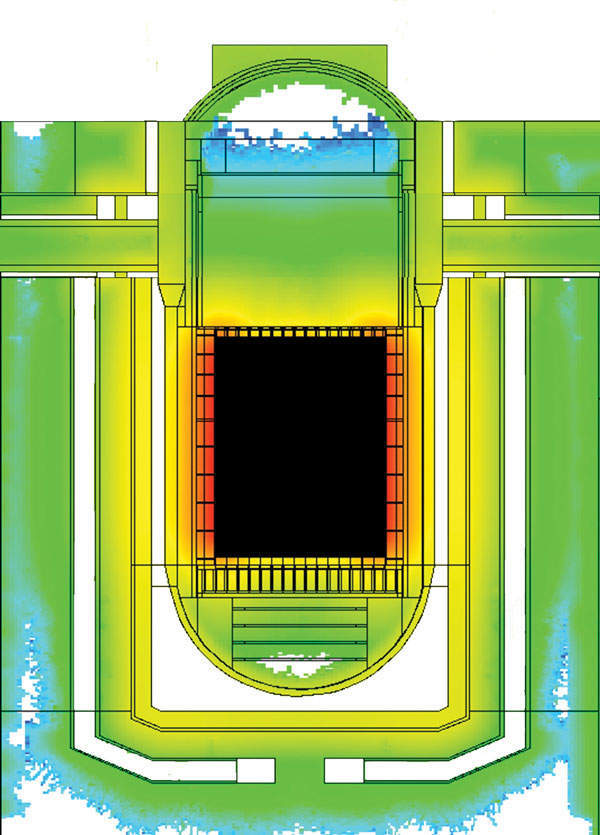
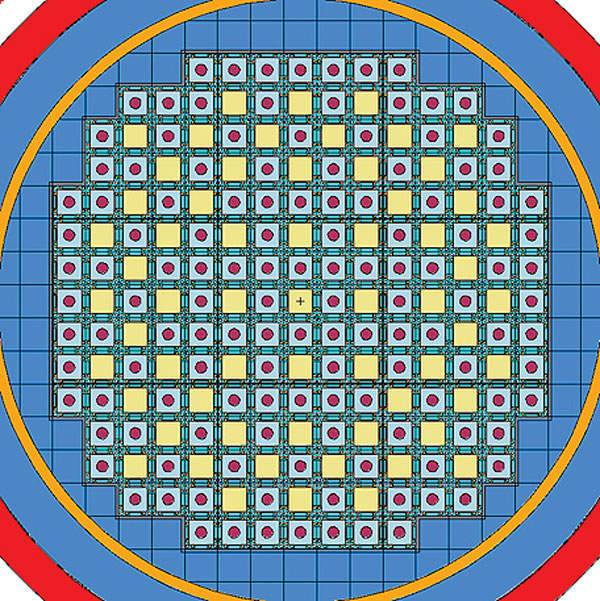
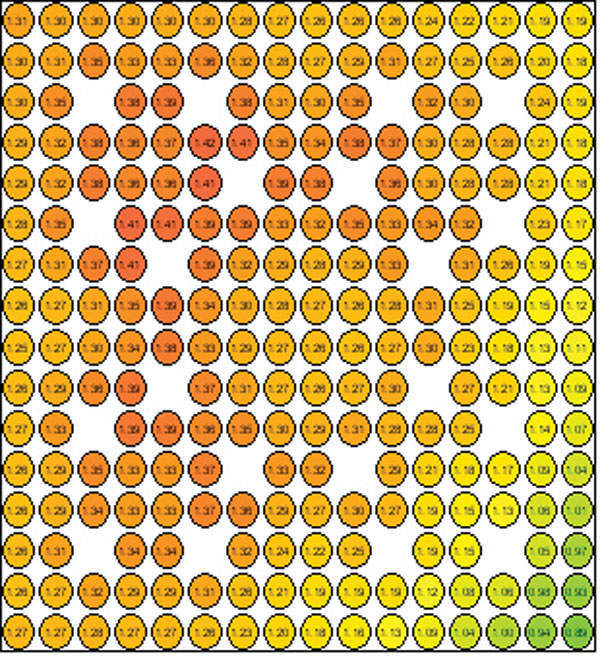
Typical power distribution in an operating nuclear power plant: representation of a reactor core with its 193 fuel elements. Red areas generate greater thermal output and more neutrons than the areas marked in blue.
We use them to give you the best experience. If you continue using our website, we'll assume that you are happy to receive all cookies on this website.
ContinueLearn More X
Typical power distribution in an operating nuclear power plant: representation of a reactor core with its 193 fuel elements. Red areas generate greater thermal output and more neutrons than the areas marked in blue.