Hydraulic model studies were conducted to evaluate and optimize the hydraulic behavior of the converging spillway, the bottom spillway and the common stilling basin at Vatnsfell hydro scheme in Iceland, writes James Yang
Vatnsfell hydroelectric scheme is a 90MW project owned and operated by Iceland National Power Company (Landsvirkjun). Construction of the scheme – the sixth large-scale power station built by Landsvirkjun – began in summer 1999 and it was put in operation in autumn 2001.
A 730m long and 30m high rock-fill dam, equipped with concrete slab facing, lies across the waterway. Together with two side dams, with heights of 10 and 4m respectively, a small reservoir was created (Figure 2). Two 125m long 4.5m diameter steel penstocks convey water from the reservoir to the two generating units, which have an installed capacity of 45MW each. The plant utilizes the head between Lake Thórisvatn and the Krókslón reservoir. The harnessed head is 67m and the total turbine flow is 160m3/sec. A tailrace canal leads from the power station to Krókslón, with a 220kV transmission line linking the station to the Sigalda power station.
Unlike other hydro stations in Iceland, Vatnsfell only produces electricity in the winter when water is diverted along a canal from Lake Thórisvatn to Krókslón. This reflects the fact that the electricity consumption in Iceland peaks in the winter. Vatnsfell is therefore a peak station, mainly producing electricity during periods of heavy load. The scheme boosts the capacity of the Iceland’s electrical grid by 430 GWh/year.
Hydraulic concerns
Two spillway structures are adopted for flood release at Vatnsfell. The overfall spillway is a converging overfall spillway (Figure 3). It is located on the 30m high main dam and consists of three parts – curved overflow crest, funnel and chute. Its axis is perpendicular to that of the dam. The main function of the structure is to cope with accidental flooding situations, serving therefore as an emergency spillway.
The layout of its crest is determined on the basis of cost optimisation with regard to the elevation of the parapet wall of the dam, the intake to the power house and the saddle dams. The spillway crest elevation is +563.5m and the crest length is 50m, resulting in a calculated discharge capacity of ~300m3/sec at the design water level. The crest is given a curved form in plan, so that the chute can easily converge to a width of 10m before entering the stilling basin. The determination of the chute width is partially due to economic reasons and partially to facilitate a future bridge structure across it. For geometric and economic reasons the spillway was placed deep in the dam fill, thus utilising the load-bearing capacity of the retaining walls and the chute slab.
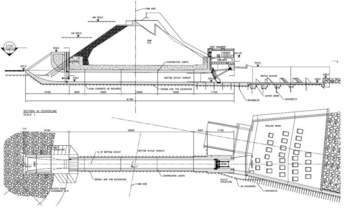
The other spillway is a bottom outlet, situated partially underneath the overfall spillway and used for daily reservoir water-level regulation (Figure 4). Its intake has the same slope as the upstream slope of the dam and is protected with rock riprap. The bottom conduit runs at an angle of 10° with the axis of the converging spillway and enters the stilling basin to the right of the spillway chute. The full discharge capacity of the outlet is estimated at 280m3/sec at the design reservoir water level.
The two spillways share an energy dissipating structure called the spatial stilling basin. The basin is designed to have an abrupt lateral expansion in the area of flow transition. Usually, a remarkable reduction in the length of the hydraulic jump is achieved with the layout (Vide et al. 1995, Vischer & Hager 1994). The basin is equipped with the baffles because there is a need to reduce the flow velocity down to 5m/sec before the water returns to the downstream river valley. The area immediately downstream of the end sill is coved with rock riprap so as to avoid erosion in the river bed, which consists of loose material.
The layout of flood discharge structures is characterized by a unique combination of hydraulic aspects. The following aspects need to be verified for the chute spillway: discharge capacity, cross-wave (shock-wave) pattern and its suppression, geometry of the splitter wall, geometry of and flow depth along the transition side-walls and forces acting on the chute slab. For the outlet, the issues to be tested include discharge capacity at different gate openings, behavior of hydraulic jump during reservoir emptying and swirling flow at the bottom intake.
For the stilling basin, the following aspects are verified and modified: basin configuration including basin length and location/height of side-walls, baffle-block configuration including positions, size, number and forces on them, possibility of using the end sill to replace baffle blocks, the geometry of the end sill and forces on it, flow velocity at the end of the basin and the rip-rap and separate and simultaneous use of the two spillways.
Vatnsfell hydraulic model
Hydraulic model studies were conducted for the flood release structures. A model was built at Vattenfall Group’s hydraulic laboratory in Älvkarleby (Figure 5). The main purpose is to evaluate and optimize the overall hydraulic behavior of the converging spillway, the bottom outlet and the common stilling basin.
The model is based on the Froude law and has a scale of 1:30. The scale choice is mainly motivated by the fact that the spillway chute converges to a width of only 10m before entering the stilling basin. Too small scale a can impose unexpected scale effects on testing results. The model covers a section of the river valley ~100m upstream of the dam and ~200m downstream, implying that the model is roughly 10m in length. The overflow spillway, the bottom outlet and the basin are all made in 2-3mm sheet steel.
Converging overfall spillway
Discharge capacity
The tests show that the flow in the reservoir approaches the spillway crest smoothly and no obvious side effect of contraction is observed. The transitional side walls upstream of the crest satisfactorily direct the flow to the crest. The flow in the spillway funnel is also smooth. The spillway crest profile is shown in Figure 6. The sill is rounded with a radius of 0.5m in the flow direction and is succeeded by the spillway funnel with a straight bottom.
The unit flow discharge, denoted as q (m3/s/m), over the spillway can be expressed by q = CH1,5, where C = discharge coefficient and H = approaching water head above the sill elevation (m). The q-H relationship is plotted in Figure 7. As an example, at H = 2.0m, the spillway can deliver a flow rate of 6.5m3/s/m, thus giving a total discharge of 6.5 x 50 = 325m3/sec. It is found that the discharge coefficient C varies between 2.2 to 2.3, which is much higher than that of conventional WES spillways that often fall in the range 1.7 – 2.0.
Chute flow behaviour
At the flow discharge 300m3/sec, the hydraulic behavior of the original design is illustrated in Figure 8. What is immediately observed is the occurrence of the cross wave, which is expected. The water flowing along the sidewalls forms, in a descriptive term, is two strong ‘jets’. When they meet, a cross wave is formed. Its location is immediately upstream of the intersection point of the sidewalls if they are prolonged. The location of the cross wave changes somewhat with the flow discharge. If the discharge is reduced, the cross wave moves a little downstream.
What was not expected is that the cross wave gives rise to overtopping of the chute sidewalls. This is also accompanied by strong aeration. Due to the unfavorable combination of the chute slope and sidewall direction, a considerable amount of water ‘leaps’ continuously over the sidewalls. Already at 150m3/sec, spray occurs, in the form of water drops, over the walls. Due to the cross wave, the bridge over the chute is also affected in a sense that water falls on it.
Cross-wave suppression
In the original design, there is a splitter wall located immediately downstream of the crest, ending upstream of the cross wave. The tests show that it has no effect on the cross-wave reduction. To suppress the cross wave, the original design needs to be modified.
Different modifications are discussed to suppress the cross wave to an accepted level. To reshape the transitional sidewalls and make the chute wider is one possibility. Another possibility is to change the profile of the chute bottom to convex shape. Both are technically feasible. To add a cover to the chute seems to be a more effective way that can be achieved without many changes in the original design (Figure 3). To build in a splitter wall centrally placed under the cover can further improve the flow situation. Figure 9 illustrates the flow behavior with the configuration of the chute cover and the splitter wall. The flow discharge is 300m3/sec.
The upstream end of the cover is placed upstream of the cross wave location at the discharge 300m3/sec, so that the water is confined under the cover even for lower flow discharges. It is found that, by lowering its downstream end to form a downward spoiler, the flow distribution into the stilling basin becomes more uniform. The total length of the cover is 14m, with its downstream end lowered by 0.7m.
The streamlined splitter wall starts about 1.0m downstream of the upper edge of the cover and ends where the cover ends. The maximum thickness of the wall is normally ~0.7m (~1.7m at the cover). In the horizontal plane, the wall has a radius of ~40 m and of ~20 m at the cover. Figure 10 shows the constructed splitter wall. To provide data for the structural design, the water surface profile along the sidewalls and the water pressure acting on the chute and the sidewalls are also measured.
Bottom outlet
The bottom outlet is composed of a rectangular tunnel, with a width of b = 3.7m and a height of h = 4.1m in cross-section, an inlet structure with a bulkhead service gate and an outlet structure with a radial gate of 6.0m in radius. Around the intake, rock rip-rap of the median diameter d50 = 200mm is adopted. The conduit is about 9 m long and has a mild slope of 0.4% in the flow direction. At the radial gate, the full opening is 4.1m, the same as the conduit height. The floor elevation of the stilling basin is +536.0m.
Flow behaviour
It is observed that, whether the radial gate is at the fully or partially open position, clock-wise swirling flow always occurs at the intake (Figure 11). Not much effort has been made to identify the reason for the vortex formation. Its occurrence is obviously related to the flow depth and the resulting velocity distribution around the inlet conditioned by the geometry. The vortex pattern belongs to the category called ‘full air core’. If floating debris and alike exists in the reservoir, there is a risk it may get sucked into the bottom outlet and cause problem for the gate operation.
The flood discharge from the bottom outlet can be written as EQUATION HERE, in which a = vertical gate opening (m), b = 3.7 m, µ = discharge coefficient, Hb = gross water head above conduit bottom elevation at radial gate (m) and g = gravitational acceleration (m/s2). The relationship between the parameters µ and a/h is given in Figure 12, where h = 4.1m. The discharge coefficient is higher at smaller and larger gate openings.
Hydraulic jump and gate operation
From previous incidents with similar layout, the designer is concerned that the hydraulic jump that builds up downstream the gate might unfavorably affect the gate operation. Within the normal interval of the reservoir level and also depending on the gate opening, the flow velocity at the gate varies between 11 – 19m/sec.
At full gate opening (irrespective of reservoir water level), twater depth downstream of the gate is roughly the same as at the gate. The hydraulic jump occurs in the form of undular waves with the gate experiencing no problems. At high reservoir water levels (irrespective of gate opening), the flow velocity at the gate is high. The high-velocity jet is strong enough to ‘push’ the hydraulic jump to a location downstream of the bridge. In this case, the jump is relatively steady.
At low water levels, the water jet from the gate becomes weak and an oscillating jump forms. Unsteadiness, irregular periodicity and surface rollers characterise the jump. At the gate opening a = 3.0m, the oscillating jump moves under the bridge. At the openings a = 1.0 and 2.0m, the velocity towards the end of the reservoir emptying is very low and the roller can move back and forth over a long distance. However, the final roller position is always 3-4m downstream of the radial gate.
Energy Dissipation
The Vatnsfell reservoir is frequently regulated with the bottom outlet. The overfall spillway is activated in emergency situations. The design of the stilling basin is based upon this fact. However, in either situation, the energy dissipation must function satisfactorily. Even combined uses of the two spillways should be investigated, so that the risk for erosion in the river valley downstream is mapped.
The basin is a spatial stilling basin. It has an abrupt change in the cross-section, also with an increasing width in the flow direction. The basin length is 34m, its width being 22 and 33m at its upstream and downstream end. The basin sidewalls have a slope of H:V ˜ 1:6 and are 7m in height. There are baffle blocks of two heights in the basin, most of them being 2m high.
Immediately downstream of the stilling basin, a section of the river bed is protected with rock riprap of sufficient size (close to the end sill d50 = 1200mm and the remaining part d50 = 400mm). The protected area, about 35m long, has an adverse slope in the flow direction – its downstream end is about 1m higher than the upstream. The river bed is composed of weakly cemented material called pillow lava breccia, its median diameter d50 ˜ 50mm (Figure 13). With effective energy dissipation, the flow velocity downstream the riprap should be reduced to such an extent that erosion is avoided in the river valley.
Layout of baffle blocks
The stilling basin was originally designed to have a total of 60 baffle blocks, placed in seven parallel rows, all 1.0m in height. Preliminary tests show that, despite the large number of blocks, the energy dissipation is not effective. The blocks are too small in relation to the flow velocity and water depth in the basin.
Velocity measurements indicate that the use of an end sill contributes to a reduction of flow velocity downstream of the basin. However, to use merely the sill without baffle blocks is not enough to damp the high-velocity flow. The velocity is too high at the rip-rap, 8 – 10m/s at the discharge 300m3/sec from the overfall spillway.
With the adoption of a 2m high end sill, larger baffle blocks than the original result in more effective energy dissipation. Based on trial and error, it is found that a proper baffle height is 2m. Larger baffle sizes would give rise to higher water stages in the basin, which in turn requires higher sidewalls. The final baffle layout is given in Figure 14.
To avoid strong aeration and also limit water cascade to outside the stilling basin (mainly on the right side), five blocks in the very upstream are given a lower height, 1.0 and 1.5m. With this layout, the flow velocity at the rip-rap can be successfully reduced to about 5m/sec at 300m3/sec from the overfall spillway or at 280m3/sec from the bottom outlet. Figure 15 shows the flow pattern of energy dissipation in the basin when the two spillways are used simultaneously.
Basin configuration
When the basin configuration is optimized, the original 108 angle proposed between the axes of the two spillways is maintained. Efforts are instead made to orientate the sidewalls.
It is observed that the right sidewall of the original design affects the bottom outlet flow adversely in a way that it ‘elbows’ the flow to the left and prevents its transverse spreading. As a result, the flow along the wall is very turbulent and strong aeration is produced. To overcome this, the right wall is moved 3m to the right at the end sill. With this adjustment, the behavior of the flow from the outlet is moderately improved.
With water discharged from the converging spillway, back flow is created along the left sidewall. The presence of the back flow is essential as it suppresses the hydraulic jump downstream of the spillway and reduces effectively its length. Without the back flow, the length of the hydraulic jump would be beyond the end sill. To move the left wall 3m at the end sill inwards does not give rise to any negative effect. In this way, the required basin size (concrete volume) is reduced.
At the stilling basin, a so-called separation wall separates the overfall spillway and the outlet. When released from the bottom outlet, the water spreads to only half of the basin width at the end sill – the left half is not used. The reason is that the water feeding transversely from the left forces the outlet jet to the right. Tests show that, by extending the wall by 2m, the energy dissipation in the basin is greatly improved. The flow spreads over almost the whole basin width at the sill. Thanks to the wider spreading, the flow velocity downstream of the end sill is effectively reduced.
Side-wall height
To the right of the stilling basin, the adjacent slope is protected with shotcrete and riprap. No measures need to be taken; even the spillway water overtops the sidewall. However, overtopping of the left sidewall is not allowed, as it would result in severe erosion in the dam toe and jeopardize the dam safety. With its original height, water runs up the sidewall at regular intervals. To determine its height, three governing flow cases are considered.
* Case A – simultaneous use of overfall spillway (300m3/sec) & bottom outlet (150m3/sec, partial opening)
* Case B – separate use of overfall spillway (300m3/sec)
* Case C – separate use of bottom outlet (280m3/sec, full gate opening)
The requisite height of the left wall is governed by the flow in both cases A and B. Taking into consideration the effect of wave run-up, the highest water level amounts to 6.7 – 7.0m. A safety margin is added to the maximum water level as the final wall height.
Forces on end sill and baffle blocks
At several locations along the end sill, water pressure is measured on both sides. For the same location, the difference in the pressures corresponds to the unit force acting on the sill. For cases A, B and C, the maximum pressure difference is ~1.6 – 1.8 m (prototype size).
To facilitate the structural design, water pressure is also measured on both front and rear sides of some representative baffle blocks. The front measuring points are directed parallel to the flow. Depending upon the flow cases (A, B & C), the baffles are subjected to a pressure difference up to 24 – 29m. As expected, the baffles situated at the very upstream of the basin take up the largest force. The pressure difference corresponds to only ~3m for the baffles close to the end sill. Negative pressure, amounting to ~1.5m, is found behind many blocks. To withstand the forces, the blocks need to be reinforced. Figure 16 shows the layout of reinforcement bars during the construction. The first three rows of baffles are totally covered with 15mm steel casing in order to protect the concrete against erosion. The fourth row is equipped with steel casing on the front.
Risk of erosion downstream
To judge the risk of erosion downstream in the river, two cross-sections are chosen for flow velocity measurement. One is located at the end sill and the other immediately downstream of the rock rip-rap. The measured velocity distributions for cases A and B are plotted in Figure 17.
In either case, the maximum velocity of the flow entering the stilling basin is estimated at 20m/sec. With the adopted layout of the basin and baffles, the velocity at the end sill is reduced to about 11.0 and 10.5m/sec in case A and B, respectively. The maximum value occurs in the middle of the basin. The velocity profile downstream the rock rip-rap follows that at the sill. Immediately downstream of the rock rip-rap, the maximum velocity corresponds to ~6.7m/sec in case A and below 5m/sec in case B (and also case C).
When the two spillways are used separately, the erosion in the river valley is under control. However, the risk of erosion exists when their use is combined, as the velocity is above 5m/sec. From the hydraulic point of view, there is some potential to improve the placement of the right sidewall downstream of the rip-rap. However, the prevailing geological conditions at the site do not permit one to do so.
Problem of water cascading after commissioning
When the dam was commissioned, the spillway was operated. The overflow spillway and the energy dissipation functioned as designed. However, problems were encountered when the bottom outlet was tested. The stilling basin experienced problems of strong water cascading onto its right rock slope from the bottom outlet.
The water cascade, jetting with high flow velocity and strong spray, occurred from the stilling basin at certain outlet discharge. The basin is adjacent to a rock slope on its right side. Starting from the flow discharge 70m3/sec, a considerable amount of the water from the outlet cascaded to the right onto the rock slope (Figure 18). The supercritical water jet from underneath the radial gate ran directly onto the upper part of the baffle blocks located downstream the gate, which gave rise to the cascade onto the right rock slope. The cascading reached farther downstream with increasing flow discharge. The problem vanished gradually when the flow exceeded about 130m3/sec. At the outlet discharge below 70m3/sec as well as above 130m3/sec, the stilling basin functioned and behaved as expected.
The water cascading from the stilling basin was not a factor that would jeopardize the safety of the dam but it was unpleasant and should be handled properly.
Potential countermeasures
The layout of the baffle blocks is given in Figure 19. There are baffle blocks of two heights in the basin, most of them being 2 m high. Five blocks, marked with “x”, are 1.5m high, and three of them are located immediately downstream of the bottom outlet. All the blocks except A are 1.6m wide. The reservoir water level of the dam varies between +556m and +563m. Within this range, the flow discharge 70 and 130m3/sec from the outlet corresponds to roughly 1.0 and 2.5 m opening. The flow velocity is about 18 – 16m/sec. The cascading problem was associated with the gate opening 1.0 – 2.5m. The improper relationship between the flow depth downstream of the gate and the block height seemed to account for its occurrence.
To solve the cascading problem, to remove, modify some baffle blocks or raise the end sill were among the potential countermeasures discussed. The most effective way was probably to cut some blocks to a lower height. However, this might degrade the function of the stilling basin, giving rise to higher flow velocity in the river. After the cutting, whether the cascading would propagate downstream in the stilling basin must also be examined.
The focus was the four blocks B, C, D and E located immediately downstream of the radial gate. The following combination of block modifications was tested. In the case of block cutting, the height was reduced by 0.5m.
* Test series (i) – removal of block B, C or both in existing layout.
* Test series (ii) – lowering of block B, D or both in existing layout.
* Test series (iii) – test series (ii) plus lowering of block C.
* Test series (iv) – lowering of blocks B, D, C, & E.
* Test series (v) – effect of higher end sill.
A proper way to confirm the reason for cascading and verify the countermeasures was to undertake hydraulic model tests, so that the flow behavior in the stilling basin could be investigated.
Model testing
The main part of the Vatnsfell model was kept in the laboratory. When the cascading problem was discovered, the model was restored. The existing flow condition was successfully reproduced in the model. Figure 20 shows the flow patterns at the discharge 110m3/sec. Compared with the prototype, the cascading seemed somewhat less extensive in the model.
Test series (i) showed that to remove one block at a time has little effect on the water cascading and the improvement was negligible. With both blocks removed, the problems with the cascading propagated further downstream, resulting in the same extent of cascading as the existing situation. Therefore, to only remove block B, C, or both did not solve the problem.
Tests in series (ii) indicated that to merely lower block B or D did not reduce the cascade in an obvious way. However, if both blocks B and D are lowered 0.5m at the same time, the situation changed greatly; the cascade onto the right side almost disappeared. Occasionally a little spray occurs onto the right side. The cascade to the left side, which occurred within the stilling basin, still remained and was acceptable.
If all the three blocks are lowered (series iii), the cascade still happens periodically onto the right side. To cut block C did not improve the situation.
With all the four blocks 0.5 m lower (series iv), the cascade almost disappeared. The hydraulic jump reached the end sill and caused somewhat higher flow velocity in the downstream area. Compared with test series (ii), the water cascading to the left side, caused by C and E, was reduced roughly to the same level as to the right. The flow behavior at higher discharges up to 280m3/sec became more acceptable.
Testing showed that the cascading was also sensitive to the end-sill height, as it affected the basin water level. If the end sill was more than 1.0m higher, the hydraulic jump was obviously improved in terms of water cascade. The cascading to the left side also became milder. To raise the sill by more than 1.0m however led to too high basin water level at high spillway discharges, which would require extra sidewall height of the basin.
Implementation in prototype
Based on the test results, it was suggested that block B and D be first cut and the bottom outlet be tested for flow discharge. After the cutting, the block tops should be sealed in some way to prevent the reinforcement bars in the blocks from corrosion. On this recommendation, the two blocks were cut in the prototype to a half-meter lower height. Flow release from the bottom outlet was made. Figure 21 shows the flow situation in the stilling basin at 100m3/sec in the prototype. The water cascade vanished at the flow rate interval 70 – 130m3/sec and the stilling basin behaved satisfactorily up to the full discharge capacity 280m3/sec. In view of this fact, no other further countermeasures were considered necessary.
Conclusion
The flood discharge structures at the Vatnsfell rock-fill dam offer a challenge in hydraulic design. The use of the converging spillway provides an alternative yet economical solution when limited space is available to construct a conventional overflow spillway. Due to the fact that the spillway chute converges in the flow direction, the occurrence of the cross wave is inevitable and has to be suppressed to avoid overtopping of the sidewalls. To let the overfall spillway and the outlet share the stilling basin is also an innovative method. To achieve satisfactory hydraulic behavior, the two spillways have to be aligned in a harmonic way with the stilling basin.
The designer of the dam has captured, in a relatively successful way, the shaping and basic dimensions of the waterway system. However, the system is complex with, for example, spatial effects involved. To only rely on design charts or empirical formulas is inadequate and could lead to engineering mistakes. To verify the design with hydraulic model tests is almost a must. As is seen in the case for Vatnsfell, the model tests have proven to be useful in the modification and finalization of the overall layout of the flood discharge structures.
Figure 1: Landsvirkjun power system and location of Vatnsfell scheme Figure 1 Figure 2: Layout of Vatnsfell hydro power scheme (the spillways to your left and the power station to your right) Figure 2 Figure 3: Vatnsfell dam – converging overfall spillway during flood discharge Figure 3 Figure 4: Vatnsfell dam – layout of bottom outlet and stilling basin Figure 4 Figure 5: Hydraulic model built for testing of flood discharge structures Figure 5 Figure 6: Overflow crest of converging spillway – longitudinal profile Figure 6 Figure 7: Converging overfall spillway – relationship between unit discharge and water head Figure 7 Figure 8: Behaviours of flow in the converging chute at 300 m3/s (original design) Figure 8 Figure 9: Spillway chute flow characteristics with cover and splitter wall added Figure 9 Figure 10: Splitter wall in spillway chute when finished Figure 10 Figure 11: Clock-wise swirling flow at bottom intake – vortex type “full air core” Figure 11 Figure 12: Bottom outlet – relationship between discharge coefficient and gate opening Figure 12 Figure 13: Erodible material (pillow lava breccia) in the river valley downstream Figure 13 Figure 14: Finalized layout of basin baffles. The end sill, 2 m high, is followed by rock riprap of the size d50 = 1200 mm Figure 14 Figure 15: Energy dissipation in stilling basin – simultaneous use of overfall spillway (300m3/sec) and bottom outlet (150m3/sec, partial opening) Figure 15 Figure 16: Construction of baffle blocks with reinforcement bars and 15 mm steel casing Figure 16 Figure 17: Flow velocity distribution at the end sill and downstream of the rock riprap Figure 17 Figure 18: Water cascade onto right rock slope due to bottom outlet discharging at 100 m3/sec Figure 18 Figure 19: Layout of bottom outlet and stilling basin with baffle blocks Figure 19 Figure 20: Reproduction of existing flow pattern, outlet discharge 110 m3/s, looking downstream Figure 20 Figure 21: Flow pattern after height reduction by 0.5 m of blocks B and D, flow rate 100m3/sec Figure 21 Author Info:
James Yang, PhD, Principal, Group Senior Specialist, Vattenfall Research & Development, SE-814 26 Älvkarleby Sweden
Fridberg Stefánsson, PhD, manager, Honnun hf Consulting Engineers, Iceland.