Characterization of radioactive contamination using geostatistics
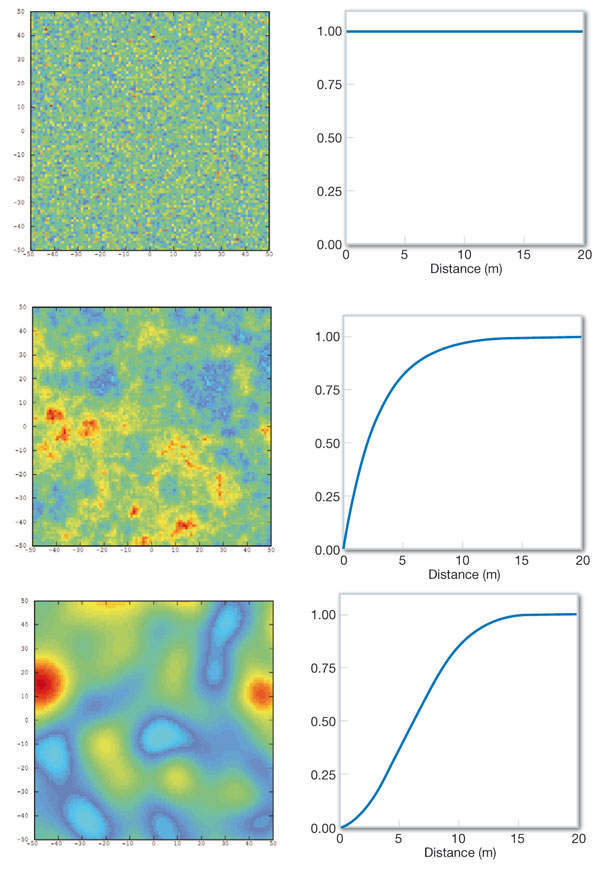
Figure 1: Three phenomena with the same statistical distribution (at left) but with significantly different spatial structures (corresponding variograms at right)
We use them to give you the best experience. If you continue using our website, we'll assume that you are happy to receive all cookies on this website.
ContinueLearn More X
Figure 1: Three phenomena with the same statistical distribution (at left) but with significantly different spatial structures (corresponding variograms at right)