The Risk Informed Safety Margins Characterization (RISMC) Pathway is a systematic approach developed to characterize and quantify safety margins of nuclear power plant structures, systems and components. The model has been tested on the Advanced Test Reactor (ATR) at Idaho National Lab. By Curtis Smith and Diego Mandelli
What differentiates the RISMC approach from traditional probabilistic risk assessment (PRA) is the concept of a safety margin. In PRA, a safety metric such as core damage frequency (CDF) is generally estimated using static fault-tree and event-tree models. However, it is not possible to estimate how close we are to physical safety limits (say peak clad temperature) for most accident sequences described in the PRA.
In the RISMC approach, what we want to understand is not just the frequency of an event like core damage, but how close we are (or not) to this event and how we might increase our safety margin through margin management strategies. In general terms, a margin is usually characterized in one of two ways:
- A deterministic margin, defined by the ratio (or, alternatively, the difference) of an applied capacity (for example, strength) to the load. For example, we test a pressure tank to failure where the tank design is rated for a pressure C, it failed at pressure L, thus the margin is (L-C) (safety margin) or L/C (safety factor).
- A probabilistic margin, defined by the probability that the load exceeds the capacity. For example, we model failure of a pressure tank where the tank design capacity is a distribution f(C), its loading condition is a second distribution f(L), the probabilistic margin would be represented by: Probability [f(L) > f(C)].
The RISMC Pathway uses the probabilistic margin approach to quantify impacts to economics, reliability, and safety. Further, we use this approach in risk-informed margins management to present results to decision makers as it relates to margin recovery strategies. As an example of the type of results that are generated via the RISMC method and tools, we show a simple hypothetical example in Figure 1. For this example, we suppose that a NPP has two alternatives to consider:
- Alternative #1: retain an existing, but ageing, component as-is
- Alternative #2: replace the ageing component with a new one.
Using the RISMC analysis methods and tools, we run 30 simulations where this component plays a role in plant response under accident conditions (note for ‘real’ cases many more simulations runs would be calculated). For each of the 30 simulations, we calculate the outcome of a selected safety metric — say peak-clad temperature — and compare that against a capacity limit (assumed to be 2200°F in this example). Simulations would have to be run for both alternative cases, resulting in a total of 60 simulations.
The results of these simulations are then used to determine the probabilistic margin (note lower values are better):
- Alternative #1: Pr (Load exceeds capacity) = 0.17
- Alternative #2: Pr (Load exceeds capacity) = 0.033
In this example, the load is the blue and red boxes shown in Figure 1 (measured by the peak clad temperature for each simulated scenario) and the capacity is the 2200°F clad-temperature limit as in 10 CFR 50.46.
If the safety margin characterization were the only decision factor, then Alternative #2 would be preferred (its safety characteristics are better) since only one case exceeded our 2200°F safety limit. Note though, that the safety margin insights are only part of the decision information that would be available to the decision maker: for example, the costs and schedules related to the alternatives would also need to be considered. In many cases, multiple alternatives would be available to the decision maker due to the level of redundancy and several barriers for safety present in current NPPs.
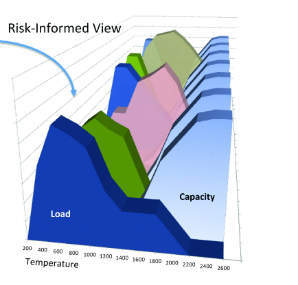
Because one objective of the LWRS program (see also box) is to develop technologies that can improve the reliability, sustain safety and extend the life of the current reactors,?any safety margin focus would need to consider more realistic load and capacity implications for operating NPPs. For example, the notional diagram shown in Figure 2 illustrates that safety, as represented by a load distribution, is a complex function that varies from one type of accident scenario to the next. However, the capacity part of the evaluation may not vary as much from one accident to the next because the safety capacity is determined by physical design elements such as fuel and material properties (which are common across a spectrum of accidents) or regulatory safety limits.
The determination of a quantitative safety margin requires an understanding of risk-based scenarios. Within a scenario, an understanding of plant behaviour (that is, operational rules such as technical specifications, operator behaviour, status of structures, systems and components) and associated uncertainty will be required to interface with a systems analysis code (for example, RELAP5). Then, to characterize safety margin for a specific safety performance metric of consideration (for example, peak clad temperature), the plant simulation will determine time and scenario-dependent outcomes for both the load and capacity. Specifically, the safety margin approach will use the physics-based plant results (the load) and contrast these to the capacity (for the associated performance metric) to determine if safety margins have been exceeded (or not) for a family of accident scenarios.
Two types of analysis
To better understand the approach to determine safety margins, we first introduce the two types of analysis used in this pathway, probabilistic and mechanistic quantification. Note that in actual applications, a blended approach is used where both types of analysis are used to support any one particular decision. For example, the approach could be either mostly probabilistic, mostly mechanistic, or both.
The use of both types of analysis, probabilistic and mechanistic, is represented in Figure 3. Probabilistic analysis is represented by the risk analysis while mechanistic analysis is represented by the plant physics calculations. Safety margin and uncertainty quantification rely on plant physics (for example, thermo-hydraulics (T-H) and reactor kinetics) coupled with probabilistic risk simulation. The coupling takes place through the interchange of physical parameters (such as pressures and temperatures) and operational or accident scenarios.
In Figure 3, the ‘plant deck’ arrows relate to the set of input file(s) needed to run a single simulation. These files (typically in text format) contain all the necessary information to perform a risk analysis (that is both deterministic and stochastic information). Various models are used for the physics simulation. The scope of the controller (shown top left of Figure 3) is to control the evolution of the simulation and to provide necessary information (for instance, values of pressure inside a specific node, status of a failure model) to both the physics and risk part of the simulation.
Case study: Applying RISMC on the Advanced Test Reactor
The purpose of the RISMC ATR case study is to demonstrate the RISMC approach using realistic plant information, including both real PRA and T-H models (the ATR has a detailed PRA, but its T-H?calculations, performed with the RELAP5 series of systems analysis tools, hardly cover risk scenarios at all). As part of this case study, we evaluated emergency diesel generator (EDG) issues, since recently ATR has investigated how to change emergency backup power at the plant. Historically, ATR has had a continually-running EDG as a backup power supply because commercial power at the INL (then called the National Reactor Testing Station) was somewhat unreliable.
Margin Recovery Strategies under consideration include:
- 1. Keep the emergency power system as is (EDG running, one in standby, commercial power as backup)
- 2. Redundant commercial power as primary backup, single new EDG as backup
- 3. Redundant commercial power as primary backup, two existing EDGs as backup
For the different strategies, we model the plant behaviour both probabilistically (that a EDG or commercial power might fail, for example) and mechanistically (the T-H behaviour under off-normal conditions). To perform this simulation, we need to use the existing PRA and T-H information (for example, RELAP5 input, and probabilities from the INL-developed SAPHIRE software used to edit and solve the probabilistic model). We then define the simulation for different scenarios and different strategies, and then run a large number of iterations to determine overall safety margins.
| Outlook |
|
The RISMC approach is being developed as part of the US Department of Energy (DOE) Light Water Reactor Sustainability (LWRS) Program, which focuses on research and development to support the long-term operation of commercial nuclear power plants. As the lead DOE Laboratory for this Pathway, the Idaho National Laboratory (INL) is tasked with developing and deploying methods and tools that support the quantification and management of safety margin and uncertainty. The Electric Power Research Institute (EPRI) has also established a long-term operations programme, which complements the LWRS Program, and a joint R&D plan has been defined outlining collaborative and cooperative R&D activities. By 2020, the RISMC Pathway hopes to deliver: By October 2013, the team plans to complete a partial-scope demonstration of RELAP-7 and RAVEN capabilities using the BWR station blackout case study. By 2014, it hopes to have completed the software structure, and plans to demonstrate the current margins analysis techniques on selected case studies. From July 2015, the margins analysis techniques should be sufficiently mature to enable industry to conduct margins quantification exercises for its own plants. Source: C. Smith, C. Rabiti, R. Martineau, Risk Informed Safety Margins Characterization (RISMC) Pathway Technical Program Plan, DOE Office of Nuclear Energy, INL/EXT-11-22977, November 2012. http://tinyurl.com/d3rjnjn |
The mechanics to conduct margins analysis for the ATR case study followed the RISMC-specific process steps, as shown in Table 1. After evaluating the proposed margin management strategies, the results indicate which of the associated safety margins are most preferential (Figure 4a). In this figure, we see that Case III would be preferred over the other two strategies when using safety as the sole decision factor.
Once we have an integrated risk-informed safety margin model with both probabilistic and mechanistic aspects, we have the ability to vary factors (such as core power) in order to see if our decisions change.
For example, we illustrate a hypothetical case in Figure 4b, where we see that the preferred margin management strategy might change depending on specifics of the plant. In this example, we see that if we increase the ATR core power to its maximum (250 MW) then it is possible that Case III is preferred over Case II, depending on the reliability of commercial power. Further, if it becomes known that the reliability of commercial offsite power is somewhat unreliable (availability of less than 0.8) then the Case I strategy may be preferential, depending on the ATR core power level.
Note that Figure 4b shows crisp boundaries between the three different cases. In many applications these boundaries may be no longer crisp but fuzzy. Such fuzziness would include for example uncertainties associated to the decision process.
Conclusions
The RISMC Pathway provides a systematic approach to the characterization of safety margins, leading to the support of margins management options (those proposed alternatives that work to control margin changes due to ageing or plant modifications). As such, it provides a vital input to the owner and regulator to support decision making for NPP operations now and for extended lifetimes.
About the authors
?Curtis Smith (curtis.smith@inl.gov) and Diego Mandelli (diego.mandelli@inl.gov), Idaho National Laboratory (INL),
2525 Freemont Ave., Idaho Falls (ID), 83415, USA.
Table 1: Margins analysis mechanics as applied to ATR
| Step # | High-level process | ATR case study |
|---|---|---|
| 1 | Characterize the issue to be resolved and the safety figures of merit to be analyzed in a way that explicitly scopes the modeling and analysis to be performed. | Focus on Emergency Diesel Generators (EDGs). Considered three possible margin management strategies |
| 2 | Describe the decision-maker and analyst’s state of knowledge (uncertainty) of the key variables and models relevant to the issue. | Focused on fuel melt scenarios (a thermal energy issue). For each strategy identified above, we calculated the probabilistic margin for fuel melt scenarios and compared the different strategies |
| 3 | Determine issue-specific, risk-based scenarios and accident timelines. | Represent initiating events. The analysis for this case study considered 10 different initiating events (out of 30 in PRA), including loss of power, routine shutdowns, and small break loss of coolant transients. -Incorporate information specific to EDG modifications. We considered the implication of changes to the plant related to backup power variations. -Extract PRA information. We used the ATR PRA as the starting point for all of the probabilistic information used in the scenario simulation step. |
| 4 | Represent plant operation probabilistically using the scenarios identified in Step 3. For example, plant operational rules (e.g., operator procedures, technical specifications, maintenance schedules) are used to provide realism for scenario generation. | A probabilistic simulation model used was created based upon the ATR PRA. We used an existing discrete event simulation modeling tool where the model consists of simulation objects that transition through various states to describe a plant-response scenario to an off-normal condition. |
| 5 | Represent plant physics mechanistically. The plant systems-level code is used to develop distributions for the key plant process variables (i.e., loads) and the capacity to withstand those loads for the scenarios identified in Step 4. Because there is a coupling between Steps 4 and 5, they each can impact the other. | ATR properties such as reactor power are used as initial inputs in the RELAP5 input deck. Upset conditions, such as a transient, changes the plant physics depending on the specifics of the scenario. Ultimately, we track pressures and temperatures through the piping loops at ATR. |
| 6 | Construct and quantify probabilistic load and capacity distributions relating to the figures of merit analyzed to determine the probabilistic safety margin. | We needed to gather the results of the integrated probabilistic (scenarios, specifically the risk analysis) and mechanistic (physics, specifically the T-H) calculations and determine the safety margin for each alternative. For the ATR case study, the safety margin was given by the number of simulations where the peak clad temperature exceeds 725 °F – in other words any simulation case that results in fuel damage is defined as having “depleted” the safety margin. |
| 7 | Determine how to manage uncharacterized risk. Because there is no way to guarantee that all scenarios, hazards, failures, or physics are addressed, the decision-maker should be aware of limitations in the analysis and adhere to protocols of good engineering practices to augment analysis. | For this initial case study, we did not formally consider model uncertainty. Later applications will consider these and other uncharacterized risks. |
| 8 | Identify and characterize the factors and controls that determine safety margin in order to propose Margin Management Strategies. Determine whether additional work to reduce uncertainty would be worthwhile or if additional (or relaxed) safety control is justified. | In addition to the safety margin values that are calculated, we have available for each simulation scenario the frequency and consequences associated with that scenario. This allows us to determine the characteristics of the safety margin. We did not perform this calculation for this case study but will investigate this approach in the future. |
| Source: Adapted from C. Smith, D. Schwieder, C. Phelan et al, ‘RISMC Advanced Test Reactor Demonstration Case Study,’ DOE Office of Nuclear Energy, INL/EXT-12-27015, August 2012, http://tinyurl.com/bn383lq |